- Offerings
- Tools & Platforms
Tools & Calculators
- Open API
- Calculators
- SIP Calculator
- CAGR Calculator
- Compound Interest Calculator
- FD Calculator
- RD Calculator
- EPF Calculator
- Retirement Calculator
- HDFC SIP Calculator
- Mutual Fund Return Calculator
- Lumpsum Calculator
- Step Up SIP Calculator
- ETF SIP Calculator
- Brokerage Calculator
- Equity Margin Calculator
- SWP Calculator
- EMI Calculator
- MTF Calculator
- Pricing
- SKY Learn
- Mutual Funds
- Margin Trading
- Financial Planning
- Personal Finance
- Share Trading
- IPO
- Derivatives
- Currencies
- Intraday Trading
- Trading Strategies
- Demat Account
- Commodity
- ETF
- What is Accumulation and Distribution Indicator (A/D)?
- The Accumulation/Distribution Indicator (A/D) Formula & Calculation
- How does Accumulation/Distribution Indicator (A/D) Work?
- How to use Accumulation and Distribution Indicators?
- Pros and Cons of Using the Accumulation/Distribution Indicator (A/D)
- The Accumulation/Distribution Indicator (A/D) vs On-Balance-Volume (OBV)
- Conclusion
- FAQs on Accumulation and Distribution Indicator(A/D)?
What is Accumulation and Distribution Indicator(A/D)?
By HDFC SKY | Updated at: Jul 25, 2025 11:04 AM IST
Summary
- Definition: The Accumulation/Distribution (A/D) Indicator is a volume-based tool that measures the cumulative flow of money into or out of a security, reflecting buying (accumulation) and selling (distribution) pressure.
- Formula:
A/D = Previous A/D + [((Close – Low) – (High – Close)) / (High – Low)] × Volume
It incorporates price position within the range and trading volume to derive money flow. - Interpretation:
- Rising A/D Line → Buying pressure, potential uptrend confirmation.
- Falling A/D Line → Selling pressure, possible downtrend continuation.
- Divergence Signal:
- Bullish Divergence: Price makes new lows but A/D rises — may indicate trend reversal upwards.
- Bearish Divergence: Price makes new highs but A/D falls — possible signal for bearish reversal.
- Comparison with OBV:
- A/D is more sensitive and nuanced than On-Balance-Volume (OBV) due to its consideration of price location within the day’s range.
- OBV focuses solely on daily closes relative to previous closes.
- Use Case: Often used to confirm trends, identify potential reversals, and support other technical indicators.
In 1992, legendary trader Marty Schwartz emphasised volume’s role in confirming price action. Later, Marc Chaikin developed the Accumulation/Distribution (A/D) Indicator, which helped traders gauge buying and selling pressure by analysing price and volume. This tool identifies accumulation in uptrends and distribution in downtrends, helping market participants spot potential reversals or continuations.
What is Accumulation and Distribution Indicator (A/D)?
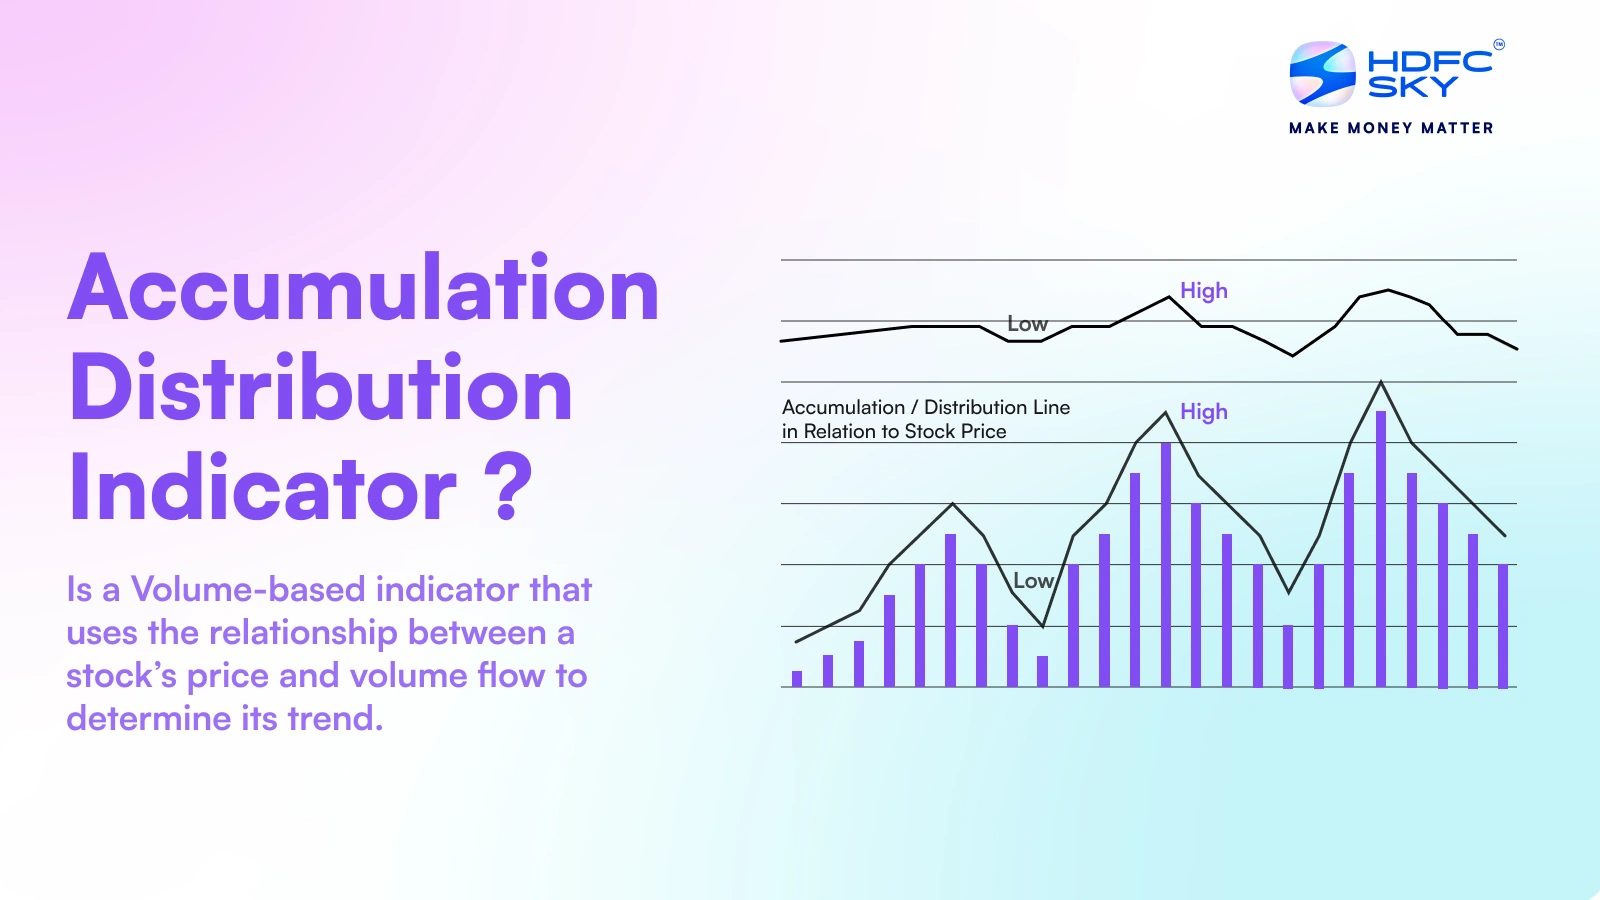
The accumulation and distribution indicator (A/D) is a volume-based indicator that uses the relationship between a stock’s price and volume flow to determine its trend. We are focusing on “accumulation” and “distribution,” which refer to the amount of buying (demand) and selling (supply) of a stock, respectively. Therefore, one may forecast a stock’s future price trajectory based on supply and demand pressures. The indicator helps to determine the stock’s accumulation and distribution phases.
The above image represents the accumulation/distribution (A/D) comparison chart of the S&P500 for a period.
The blue line is the S&P500 over the period, and the green line is the Accumulation and Distribution Indicator line for the same period. As you can see, the accumulation and distribution line correlates to the stock price. When the stock price was low, the accumulation and distribution indicator line was low; when the stock price was high, the accumulation and distribution indicator line was high.
Let’s understand the accumulation and distribution formula along with the accumulation and distribution calculations required to plot the A/D line on the chart.
The Accumulation/Distribution Indicator (A/D) Formula & Calculation
The Accumulation Distribution Indicator Line (ADL) can be calculated in three steps –
- The first step is to determine the Money Flow Multiplier.
- Then, the Money Flow Volume is calculated by multiplying this amount by the volume.
- Third, construct the Accumulation Distribution Indicator Line (ADL) by calculating the running sum of Money Flow Volume.
Accumulation Distribution Indicator Formula:
- Money Flow Multiplier = [(Close – Low) – (High – Close)] /(High – Low)
- Money Flow Volume = Money Flow Multiplier x Volume for the Period
- ADL = Previous ADL + Current Period’s Money Flow Volume
The above three formulas are used to calculate the accumulation distribution.
The Money Flow Multiplier ranges from +1 to -1, determining the Money Flow Volume and the Accumulation Distribution Line. A positive multiplier indicates buying pressure, while a negative one signals selling pressure. Volume impact varies, reaching full effect at extremes (+1 or -1) and reducing when the multiplier is between these values.
How does Accumulation/Distribution Indicator (A/D) Work?
The Accumulation Distribution’s actual value is not essential; its direction matters. An uptrend continues if both price and Accumulation Distribution make higher peaks and troughs, while a downtrend continues if both make lower peaks and troughs. Rising Accumulation Distribution in a trading range signals accumulation and a possible upward breakout while falling Accumulation Distribution suggests distribution and a potential downward breakout.
The Accumulation Distribution Line considers the close relative to the high-low range, ignoring period-to-period changes. Negative divergence occurs when the price makes higher peaks, but Accumulation Distribution does not, signalling a weakening uptrend. Positive divergence signals a potential reversal in downtrends.
How to use Accumulation and Distribution Indicators?
The Accumulation Distribution indicator can be a useful trading tool when appropriately applied. The following are some Accumulation Distribution indicator strategies for using this technical indicator effectively:
- Knowing the signals that the Accumulation Distribution indicator Line produces: A possible bullish reversal is indicated by positive divergence, a rising Accumulation Distribution indicator Line and a dropping price. Conversely, a potential bearish reversal is indicated by negative divergence, which consists of a rising price and a declining A/D Line.
- Adding additional indicators to the Accumulation Distribution indicator: To increase the precision of your research, use the Accumulation Distribution Line with additional technical indicators like simple moving averages and the Relative Strength Index (RSI).
- Finding the points of entry and exit: A possible entry or departure point may be indicated when the Accumulation Distribution Line breaks above or below a trendline or support/resistance level.
Pros and Cons of Using the Accumulation/Distribution Indicator (A/D)
Let us now discuss the pros and cons of using A/D indicator in detail
Pros of Using the Accumulation Distribution Indicator:
- Identifies Trend Strength: The Accumulation Distribution Indicator helps you assess trend strength by comparing price movements with volume flow. The divergence between the price and the Accumulation Distribution line may indicate potential trend reversals.
- Reveals Buying/Selling Pressure: It provides insights into market sentiment by revealing whether buying or selling pressure dominates. A rising Accumulation Distribution line suggests accumulation, while a falling Accumulation Distribution line indicates distribution.
- Easy to Interpret: The A/D indicator is a simple visual tool, making it relatively easy for traders to understand and interpret market trends.
- Confirmation Tool: When the Accumulation Distribution Indicator is combined with other technical indicators, the Accumulation Distribution line helps confirm potential trend changes and strengthens trading signals.
- Applicable Across Markets: The A/D indicator can be used in different markets, including stocks, forex trading, and futures, making it versatile for traders.
Cons of Using the Accumulation Distribution Indicator
- Lagging Indicator: Since the Accumulation Distribution line relies on past price and volume data, it may generate signals after significant price movements. However, it can be a leading indicator when divergence appears before price reversals.
- False Signals in Volatile Markets: High market volatility can cause erratic volume fluctuations, leading to misleading signals.
- Does Not Account for Price Gaps: The Accumulation Distribution Indicator does not treat price gaps in the same way as other indicators, which can result in inaccurate trend assessments during large price jumps.
- Requires Additional Analysis: It is risky to rely solely on the Accumulation Distribution Indicator. It should be used alongside other analyses, such as technical and fundamental.
- May Not Capture Subtle Changes: Minor shifts in volume may not be reflected on the A/D line, potentially missing critical market nuances.
The Accumulation/Distribution Indicator (A/D) vs On-Balance-Volume (OBV)
The Accumulation Distribution Line and On Balance Volume (OBV) are cumulative volume-based indicators but differ in calculation and interpretation. The table below highlights the key differences between these indicators.
| Feature | Accumulation Distribution Line (A/D) | On Balance Volume (OBV) |
| Developer | Marc Chaikin | Joe Granville |
| Concept | Measures accumulation and distribution based on price’s close relative to its high-low range | Measures positive and negative volume flow based on price changes from one period to the next |
| Calculation | Focuses on whether the close is near the high or low of the period | Adds volume when price closes higher, subtracts volume when price closes lower |
| Gaps in Price | Ignores gaps; the Accumulation Distribution line may rise even if price gaps down, provided the close is near the high | Reacts to gaps; OBV decreases when the close is lower than the previous close |
| Usage | Used to identify buying and selling pressure and potential breakouts | Used to confirm trends or spot divergences with price movements |
Conclusion
The Accumulation Distribution Line reflects volume flow, with uptrends indicating buying pressure and downtrends signalling selling pressure. Bullish and bearish divergences may suggest reversals. However, it should not be used alone and works best alongside momentum oscillators and chart patterns for accurate technical analysis.
Related Articles
FAQs on Accumulation and Distribution Indicator(A/D)?
Is an Accumulation Distribution Indicator Good?
The A/D indicator helps traders assess market trends by identifying buying and selling pressure. While helpful in confirming trends and spotting divergences, it should be used with other tools and indicators. Combining A/D with momentum oscillators or chart patterns enhances accuracy, making it a valuable tool when integrated with broader technical analysis.
How to Use the Accumulation and Distribution Indicator?
The A/D indicator confirms trends, identifies reversals, and detects breakouts. Rising A/D during consolidation signals accumulation and a possible upward breakout, while falling A/D suggests distribution and a potential decline. Traders often use A/D alongside moving averages or RSI to strengthen trade signals.
What Is the ADL Indicator Strategy?
The Accumulation Distribution Line (ADL) strategy uses A/D trends to confirm price movements and detect divergences. A rising A/D with higher price highs confirms an uptrend, while a falling A/D with lower price lows supports a downtrend. Divergences signal weakening trends, helping traders anticipate potential reversals.
How to Read an Accumulation Distribution Indicator?
The Accumulation Distribution (A/D) indicator measures buying and selling pressure by analysing price and volume. A rising A/D line suggests accumulation, indicating stronger demand, while a falling A/D line signals distribution, suggesting increased selling pressure. Divergences between price and A/D can indicate potential trend reversals or continuations.
What Does the Accumulation/Distribution Indicator (A/D) Tell You?
The A/D indicator reveals whether volume is supporting a price trend. If the price rises while A/D declines, the trend may lack strength. Conversely, rising A/D with price confirms strong momentum. Traders use A/D to analyse buying and selling pressure, helping identify continuation patterns and potential reversals.

