- Offerings
- Tools & Platforms
Tools & Calculators
- Open API
- Calculators
- SIP Calculator
- CAGR Calculator
- Compound Interest Calculator
- FD Calculator
- RD Calculator
- EPF Calculator
- Retirement Calculator
- HDFC SIP Calculator
- Mutual Fund Return Calculator
- Lumpsum Calculator
- Step Up SIP Calculator
- ETF SIP Calculator
- Brokerage Calculator
- Equity Margin Calculator
- SWP Calculator
- EMI Calculator
- MTF Calculator
- Pricing
- SKY Learn
- Mutual Funds
- Margin Trading
- Financial Planning
- Personal Finance
- Share Trading
- IPO
- Derivatives
- Currencies
- Intraday Trading
- Trading Strategies
- Demat Account
- Commodity
- ETF
What are Bollinger Bands & How do Bollinger Bands Work?
By HDFC SKY | Updated at: Nov 19, 2025 12:29 PM IST
Bollinger Bands are a popular technical analysis tool used by traders to measure market volatility and identify potential buy or sell opportunities. Developed by John Bollinger this indicator consists of a simple moving average (SMA) and two standard deviation lines plotted above and below it. By capturing price movement within a banded range Bollinger Bands help traders understand whether an asset is overbought or oversold, making them a valuable tool for spotting trend reversals and breakout points.
What are Bollinger Bands?
Bollinger Bands are a popular technical analysis tool used to measure market volatility. They consist of a middle moving average line and two outer bands placed above and below it, typically two standard deviations away. These bands expand and contract based on price fluctuations, helping traders identify potential overbought or oversold conditions and possible trend reversals.
How to Calculate Bollinger Bands?
To calculate Bollinger Bands, follow these steps:
- Calculate the Middle Band: This is usually a simple moving average (SMA) of the closing prices over a set period, commonly 20 days.
- Calculate the Standard Deviation: Measure the volatility of the price over the same period as the SMA.
- Calculate the Upper Band: Add two times the standard deviation to the middle band.
- Upper Band = Middle Band + (2 × Standard Deviation)
- Calculate the Lower Band: Subtract two times the standard deviation from the middle band.
- Lower Band = Middle Band – (2 × Standard Deviation)
These bands adjust dynamically with price volatility, helping identify trading opportunities.
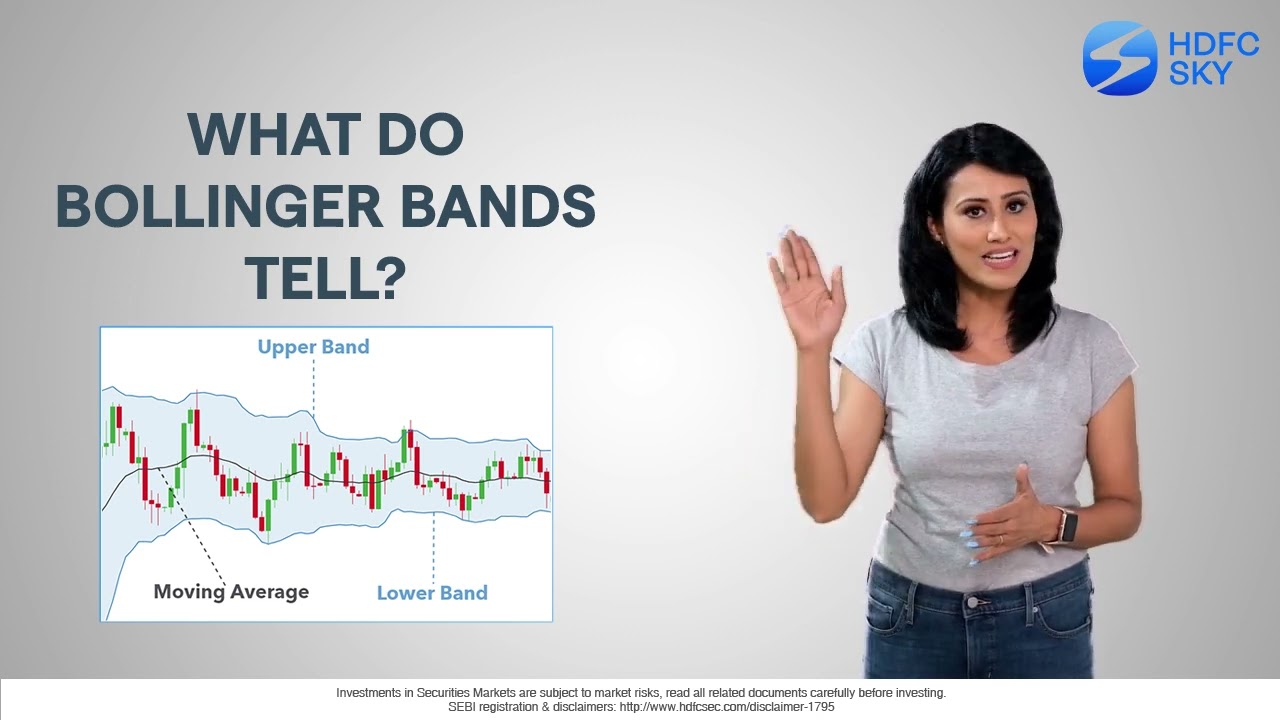
What do Bollinger Bands tell?
Bollinger Bands are believed to give an idea to traders about the stock being overbought or oversold. They bracket the 20-day SMA with an upper and lower band, along with the daily movements of the stock price.
If the stock price moves closer to the upper band, it is believed to be overbought. If the price moves closer to the lower band, the stock is believed to be oversold. When there is high volatility, the bands widen, while during periods of low volatility, the bands contract. This is because the standard deviation is a measure of volatility.
How do Bollinger Bands work?
Bollinger Bands work by measuring market volatility and price levels relative to a moving average. They consist of three lines: a middle band (usually a 20-day simple moving average), an upper band and a lower band. The upper and lower bands are set typically two standard deviations above and below the middle band.
When the bands widen, it indicates higher volatility; when they contract, volatility is low. Prices moving near the upper band suggest the asset might be overbought, while prices near the lower band suggest it might be oversold. Traders use these signals to identify potential entry or exit points, trend strength, and possible reversals. However Bollinger Bands work best when combined with other indicators for confirmation.
How to Use Bollinger Bands
Bollinger Bands help traders understand market volatility and potential price reversals. By analysing price movements relative to the bands, traders can make informed decisions.
- Identify Volatility: Bands widen during high volatility and contract when volatility is low, signaling possible price breakouts.
- Overbought/Oversold Signals: Prices near the upper band may indicate overbought conditions, while those near the lower band suggest oversold.
- Trading the Squeeze: A narrow band or “squeeze” indicates low volatility, often followed by a sharp price move.
- Confirm Trends: Combine Bollinger Bands with other indicators like RSI for better trend confirmation.
- Entry and Exit Points: Use the bands to time buying near the lower band and selling near the upper band in trending markets.
Bollinger Bands Indicator
The Bollinger Bands indicator is a popular technical analysis tool used to measure market volatility and identify overbought or oversold conditions in a security’s price. It consists of three lines:
- Middle Band: A simple moving average (typically 20 periods).
- Upper Band: Positioned two standard deviations above the middle band.
- Lower Band: Positioned two standard deviations below the middle band.
The bands expand and contract based on price volatility. When the bands are wide, it signals high volatility; when narrow, low volatility. Prices near the upper band may indicate overbought conditions, while prices near the lower band may suggest oversold levels. Traders use this indicator to spot potential trend reversals, breakouts and price targets.
Advantages of Bollinger Bands
Bollinger Bands are a popular technical analysis tool that helps traders understand market volatility and identify potential entry and exit points. Their dynamic nature makes them adaptable to different market conditions.
- Visualises Volatility: The bands widen during high volatility and contract when the market is stable.
- Identifies Overbought/Oversold Conditions: Prices touching the upper band may indicate overbought levels while touching the lower band may signal oversold conditions.
- Versatile: Suitable for use in trending and sideways markets.
- Enhances Other Indicators: Can be combined with RSI, MACD and other tools for more accurate signals.
- Dynamic Adjustment: Unlike fixed indicators, Bollinger Bands adjust based on recent price movements.
Disadvantages of Bollinger Bands
While Bollinger Bands are useful they have certain limitations that traders should be aware of before relying solely on them.
- False Signals: Can give misleading signals during strong trends or low volatility phases.
- Lagging Indicator: Based on moving averages, so it reacts to past price data and may delay signals.
- Not Standalone: Requires confirmation from other indicators for reliable trading decisions.
- Subjectivity: Interpretation of band touches and squeezes can vary among traders.
- Less Effective in Trending Markets: May generate premature exit signals when the market trends strongly.
Bollinger Bands Strategy
Bollinger Bands help traders identify price volatility and potential entry or exit points. Here’s a simple strategy using them:
- Band Squeeze: When the bands contract tightly, it signals low volatility and a possible upcoming breakout. Prepare to trade in the direction of the breakout once price moves strongly beyond the bands.
- Buy Signal: When price touches or dips below the lower band and then closes back inside, it could signal oversold conditions and a buying opportunity.
- Sell Signal: When price hits or exceeds the upper band and then falls back inside, it may indicate overbought conditions and a selling opportunity.
- Use with Other Indicators: Confirm signals with volume, RSI or MACD for better accuracy.
This strategy helps capitalise on price volatility and potential reversals.
Conclusion
Bollinger Bands are a valuable tool for analysing market volatility and spotting potential trading opportunities. By combining a moving average with upper and lower deviation bands, they help traders understand whether prices are stretched or stabilising. Although Bollinger Bands can highlight overbought or oversold conditions and signal upcoming breakouts, they should not be used in isolation. Since market movements can be unpredictable, pairing Bollinger Bands with indicators such as RSI or MACD improves accuracy and reduces false signals. With proper practice and confirmation tools, traders can use Bollinger Bands to make clearer and more confident trading decisions.
Related Articles
FAQs
What are Bollinger Bands in simple terms?
Bollinger Bands are three lines that show how much a price is moving. They help traders see if a market is calm or volatile.
What do Bollinger Bands indicate?
Prices near the upper band may indicate overbought levels and prices near the lower band may suggest oversold conditions.
Which indicator works best with Bollinger Bands?
Most traders pair them with RSI, MACD or volume indicators for confirmation.
What is the best Bollinger Band setting?
The standard setting is a 20-day simple moving average with upper and lower bands set two standard deviations away.
Are Bollinger Bands accurate?
They are helpful for spotting volatility shifts but should not be used alone because they can produce false signals.

