- Offerings
- Tools & Platforms
Tools & Calculators
- Open API
- Calculators
- SIP Calculator
- CAGR Calculator
- Compound Interest Calculator
- FD Calculator
- RD Calculator
- EPF Calculator
- Retirement Calculator
- HDFC SIP Calculator
- Mutual Fund Return Calculator
- Lumpsum Calculator
- Step Up SIP Calculator
- ETF SIP Calculator
- Brokerage Calculator
- Equity Margin Calculator
- SWP Calculator
- EMI Calculator
- MTF Calculator
- Pricing
- SKY Learn
- Mutual Funds
- Margin Trading
- Financial Planning
- Personal Finance
- Share Trading
- IPO
- Derivatives
- Currencies
- Intraday Trading
- Trading Strategies
- Demat Account
- Commodity
- ETF
- What is the Bull Flag Pattern?
- Characteristics of a Bull Flag Pattern
- When is a Bullish Flag Pattern Formed in Charts?
- What Does a Bull Flag Chart Pattern Look Like?
- How to Identify a Bull Flag Pattern?
- What Does a Bullish Flag Chart Pattern Indicate?
- How to Trade a Bull Flag Pattern?
- Advantages of Bull Flag Pattern
- Disadvantages of Bull Flag Pattern
- How Reliable is a Bull Flag Pattern?
- Common Mistakes While Trading Bull Flag Pattern
- Bull Flag Pattern Trading Strategies
- Conclusion
What is the Bull Flag Pattern & How to Identify a Bull Flag Pattern?
By HDFC SKY | Updated at: Oct 9, 2025 05:25 PM IST
- Bull Flag Pattern Overview: The bull flag is a bullish continuation pattern indicating a temporary consolidation before the uptrend resumes. It comprises a sharp price rise (flagpole), followed by a downward-sloping consolidation (flag), and then a breakout above resistance.
- Key Components:
- Flagpole: Strong, steep rally with high volume.
- Flag: Short-term downward or sideways consolidation on declining volume.
- Breakout: Price breaks above the flag resistance, ideally with increased volume.
- Trading Strategy:
- Entry Point: Enter long when the price breaks above the flag’s upper trendline.
- Stop-Loss: Place just below the flag’s lower trendline.
- Target Price: Measure the flagpole height and add it to the breakout level.
- Technical Indicators:
- Use volume analysis, moving averages, and RSI to confirm breakout strength and avoid false signals.
- Market Implication: Signals strong bullish momentum, commonly used in trending markets to time re-entry points.
The Bull Flag Pattern is a bullish continuation chart pattern that signals a brief pause or consolidation after a strong upward price move. It indicates that the price is likely to continue rising once the pattern completes, making it a popular tool for traders looking to identify potential buying opportunities in an uptrend.
What is the Bull Flag Pattern?
A Bull Flag Pattern is a technical chart formation that indicates a brief consolidation or pullback after a strong upward price move, resembling a flag on the chart. It signals the continuation of the existing bullish trend, suggesting that prices are likely to rise further once the pattern completes. Traders use this pattern to identify potential entry points during an uptrend
Characteristics of a Bull Flag Pattern
The Bull Flag Pattern is identified by a strong upward move followed by a brief period of consolidation forming a rectangular shape that slopes downward. This pattern indicates a pause before the uptrend continues.
1. The Pole (aka the Prevailing Trend)
The pole represents the initial surge in price, often triggered by positive news, increased demand or a breakout from a previous resistance level.
The steep ascent is accompanied by high trading volumes, reinforcing the strength of the upward trend. The pole’s height is an important metric. This is because it helps determine the pattern’s target price after the breakout.
2. The Flag (aka the Consolidation Phase)
The flag represents the consolidation period when the price oscillates within a narrow channel. This phase reflects cautious accumulation by new participants and profit-taking by early buyers.
The flag often slopes downward or forms a horizontal channel and declining trading volumes indicate reduced activity.
3. Volume Indicators
Volume plays a critical role in validating the bull flag pattern. During the initial surge (the pole) trading volumes typically spike, reflecting robust buyer interest.
As the pattern transitions into the flag phase, volumes decline. This indicates reduced selling pressure and a pause in market activity.
This drop in volume underscores the consolidation phase, where prices stabilise within a confined range. When the breakout occurs a renewed surge in volume acts as a confirmation signal, suggesting strong participation and increasing the likelihood of a successful continuation.
4. Price Breakout
A breakout occurs when the price decisively moves above the flag’s upper trendline, accompanied by increased volume. This breakout confirms the pattern and signals the resumption of the uptrend.
The target price is typically calculated by adding the pole’s height to the breakout level, providing a measurable trading objective.
5. Bullish Continuation
Bullish continuation after a price breakout in the bull flag pattern is a powerful signal for traders. Following the breakout above the flag’s resistance, the price often resumes its upward trajectory with renewed momentum.
A surge in trading volumes typically accompanies this continuation and confirms strong buying interest.
When is a Bullish Flag Pattern Formed in Charts?
The bullish flag pattern typically appears in strong trending markets, particularly during periods of heightened volatility. It often follows a significant upward move driven by bullish catalysts, such as earnings beats, regulatory approvals or sector-wide rallies.
The pattern signifies a temporary equilibrium between profit-taking sellers and accumulating buyers. Bullish flags are commonly observed in high-growth sectors like IT, pharmaceuticals and financial services.
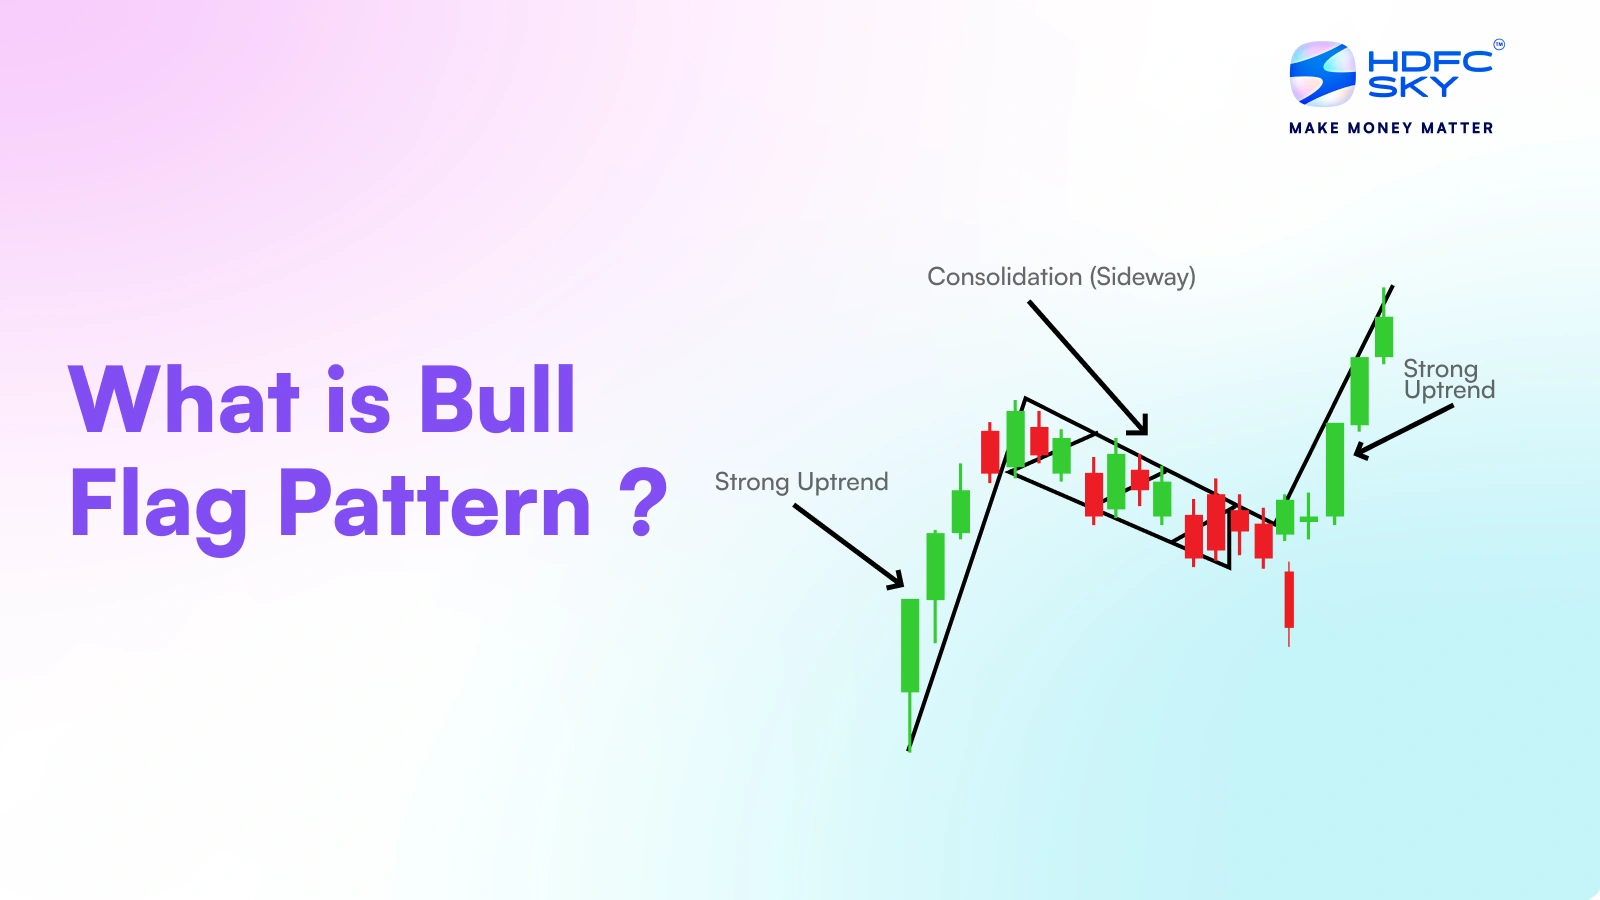
What Does a Bull Flag Chart Pattern Look Like?
The bull flag candlestick pattern is a distinct structure, characterised by a steep, almost vertical price rise followed by a consolidation phase. The initial sharp upward movement forms the pole, reflecting intense bullish momentum and high trading volumes. This segment often appears as a straight or slightly angled line on a price chart, showcasing minimal retracement.
The flag develops as the price enters a consolidation phase, creating a rectangular or downward-sloping channel. This phase is marked by reduced trading volumes and smaller price movements confined between two parallel trendlines. The flag often leans slightly against the prevailing trend, forming a counter-trend pattern highlighting a temporary pause in buying activity.
Visually the bull flag candlestick pattern resembles a traditional flag mounted on a pole, with the price action during the consolidation phase providing a clear and structured pattern. This visual clarity makes the bull flag one of technical analysis’s most recognisable continuation patterns.
How to Identify a Bull Flag Pattern?
Identifying a bull flag pattern involves recognising its three core elements:
- Pole Formation: Look for a sharp, almost vertical price increase, typically supported by high trading volumes. This indicates strong bullish momentum.
- Flag Formation: Identify a consolidation phase where the price moves within two parallel trendlines, either downward-sloping or horizontal. Ensure that trading volumes decrease during this phase, highlighting reduced market activity.
- Breakout Confirmation: Look out for a breakout above the upper trendline of the flag, accompanied by a volume surge. This confirms the pattern and signals an ideal entry point.
Technical indicators like moving averages, RSI (Relative Strength Index) and MACD (Moving Average Convergence Divergence) can complement visual identification. For example, a rising 50-day moving average often aligns with the pole’s formation, providing additional validation.
What Does a Bullish Flag Chart Pattern Indicate?
A bull flag indicates a strong underlying uptrend in the market. The initial price surge reflects robust buying momentum, while the consolidation phase signals a temporary pause where buyers and sellers reach equilibrium.
This balance often precedes a breakout, highlighting renewed buying interest and confidence in further price increases. Traders see this pattern as a signal to enter positions, aiming to capitalise on the continuation of the bullish trend.
How to Trade a Bull Flag Pattern?
Trading a Bull Flag Pattern involves spotting a strong uptrend followed by a brief consolidation before the price continues higher. It signals a potential buying opportunity after the breakout.
- Identify the flagpole, which is a sharp price rise.
- Observe the flag, a small downward or sideways channel.
- Wait for the price to break above the flag’s resistance level.
- Enter a buy position once the breakout is confirmed with high volume.
- Place a stop loss below the flag to limit potential losses.
- Set a target price based on the length of the flagpole projected upward.
Advantages of Bull Flag Pattern
The Bull Flag Pattern offers traders a clear signal of trend continuation, helping to identify potential buying opportunities. It also helps in setting precise entry and exit points.
- Indicates strong bullish momentum
- Helps traders identify low-risk entry points
- Provides clear breakout signals for trend continuation
- Assists in setting stop-loss levels below the consolidation zone
- Useful in both short-term and long-term trading strategies
Disadvantages of Bull Flag Pattern
While the Bull Flag Pattern is useful, it has its drawbacks. It can sometimes give false signals, leading to potential losses if the breakout fails.
- Prone to false breakouts causing misleading trade signals
- Requires confirmation to avoid premature entries
- Less reliable in highly volatile or sideways markets
- May not work well during major trend reversals
- Needs experience to identify accurately and trade effectively
How Reliable is a Bull Flag Pattern?
The Bull Flag Pattern is considered fairly reliable when confirmed with volume and other technical indicators. However, like all patterns it’s not foolproof and can give false signals.
- Reliability increases with strong volume during breakout
- Best used with other indicators for confirmation
- Less reliable in volatile or choppy markets
- Requires proper risk management due to occasional failures
Common Mistakes While Trading Bull Flag Pattern
Traders often rush into trades without waiting for proper confirmation, leading to potential losses. Ignoring key signals like volume can also cause misjudgment.
- Entering Too Early: Buying before the price breaks out of the flag can lead to losses if the pattern fails.
- Ignoring Volume: Failing to check for increased volume during breakout weakens confirmation of the pattern.
- Poor Stop-Loss Placement: Setting stop-losses too tight or too loose can result in premature exits or large losses.
- Ignoring Overall Trend: Trading the pattern against the primary market trend reduces the probability of success.
- Overtrading: Chasing every flag pattern without proper analysis may lead to unnecessary risks.
- Neglecting Risk Management: Not defining risk-reward ratios before trading can hurt long-term profitability.
- Ignoring Confirmation Indicators: Relying solely on the pattern without other technical signals can cause false trades.
Bull Flag Pattern Trading Strategies
The Bull Flag Pattern is a powerful tool for traders to identify continuation signals in an uptrend. To effectively use this pattern, traders can apply various strategies that help maximise profits while managing risk.
- Entry Point Strategy: Enter a trade when the price breaks above the upper resistance line of the flag, confirming the continuation of the uptrend.
- Stop-Loss Placement: Place stop-loss orders just below the lower support trendline of the flag to limit potential losses.
- Target Price Calculation: Measure the length of the flagpole and project it upwards from the breakout point to estimate the potential target price.
- Volume Confirmation: Look for increased trading volume during the breakout to validate the strength of the move.
- Combining Indicators: Use additional technical indicators like RSI or MACD to confirm momentum before entering the trade.
- Trade Management: Monitor price action closely after breakout and consider trailing stop-losses to lock in profits as the price advances.
These strategies help traders capitalise on the Bull Flag Pattern while minimising risks associated with false breakouts or trend reversals.
Conclusion
The bull flag pattern is a cornerstone of technical analysis. It provides clear insights into market momentum and opportunities for continuation trades. By understanding its formation, breakout behaviour and practical applications, traders can refine their strategies and enhance decision-making. To maximise its reliability and effectiveness, always pair this pattern with volume analysis and other indicators.
Related Articles

