- Offerings
- Tools & Platforms
Tools & Calculators
- Open API
- Calculators
- SIP Calculator
- CAGR Calculator
- Compound Interest Calculator
- FD Calculator
- RD Calculator
- EPF Calculator
- Retirement Calculator
- HDFC SIP Calculator
- Mutual Fund Return Calculator
- Lumpsum Calculator
- Step Up SIP Calculator
- ETF SIP Calculator
- Brokerage Calculator
- Equity Margin Calculator
- SWP Calculator
- EMI Calculator
- MTF Calculator
- Pricing
- SKY Learn
- Mutual Funds
- Margin Trading
- Financial Planning
- Personal Finance
- Share Trading
- IPO
- Derivatives
- Currencies
- Intraday Trading
- Trading Strategies
- Demat Account
- Commodity
- ETF
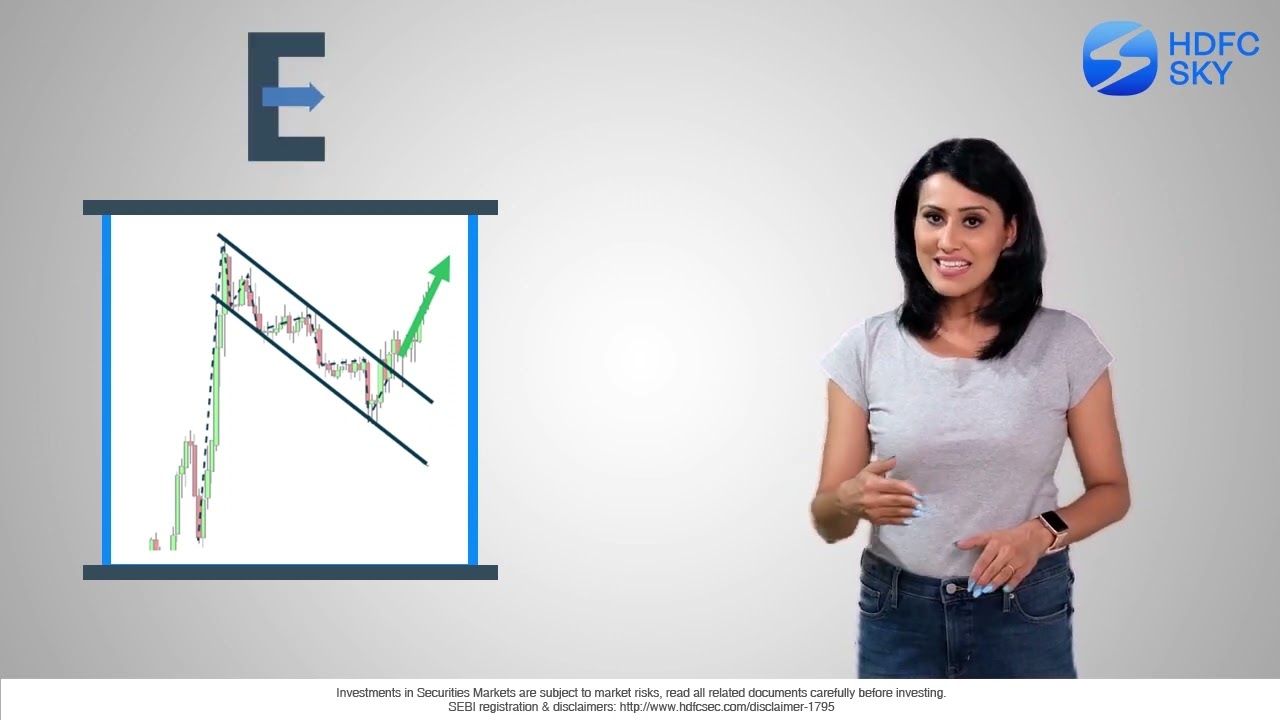
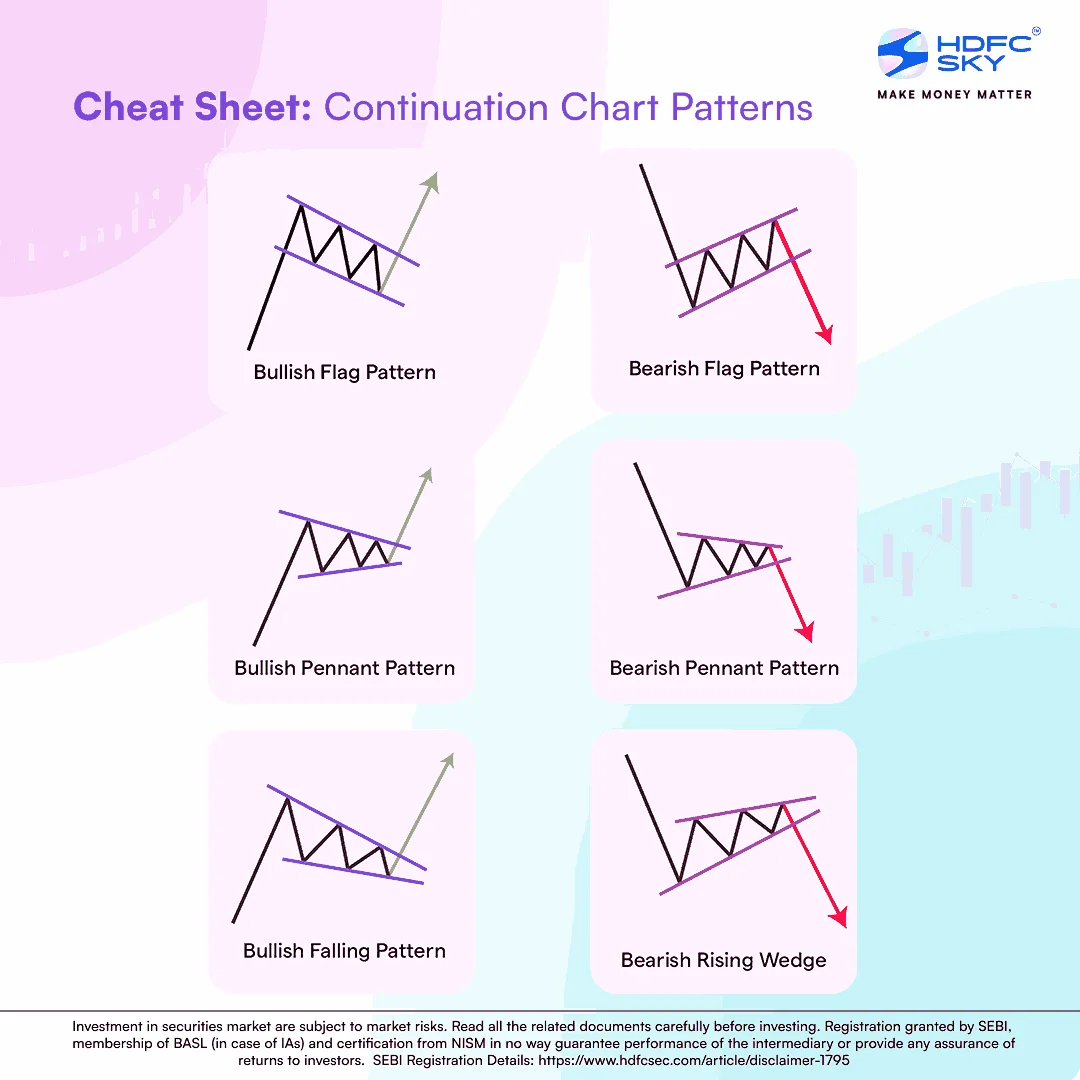
Continuation Chart Patterns
By HDFC SKY | Updated at: Apr 8, 2025 03:16 PM IST
Summary
Now that we have a basic idea of the tools technical analysts use, let’s understand how they apply them to forecast future market movements.
Patterns are the distinctive formations created by a stock’s price movements on a chart and can be termed the foundation of technical analysis. Chart patterns can be categorised as continuation patterns and reversal patterns.
When a chart pattern signals a change in trend direction, it is called a reversal pattern. We will cover this in the next chapter.
A continuation pattern appears when the trend continues in its original direction following a brief pause. This provides traders with favourable entry levels to trade in the direction of the original trend.
Let’s look at some of the most common continuation patterns and how these can be used to improve your trading.
Flag patterns
Flag patterns are short-term continuation patterns that result in a price breakout in the original trend direction after a brief consolidation period. It is called a flag pattern as it resembles a ‘flag’ on a ‘flagpole’.
The ‘flag’ is the consolidation phase. It is called a flag as it resembles a small rectangular body composed of minor support and resistance levels joined by parallel trendlines. During the consolidation phase, the price moves within this channel. A flag pattern is confirmed once the price breaks out from the channel in the direction of the original trend.
The pattern can be both bullish or bearish and typically plays out anywhere from five to 20 price bars. The flag is expected to appear in the middle of the pattern. Hence, the target is usually the length of the flagpole from the point of breakout in the resistance trendline (in case of a bullish flag) or support trendline (in case of a bearish flag).
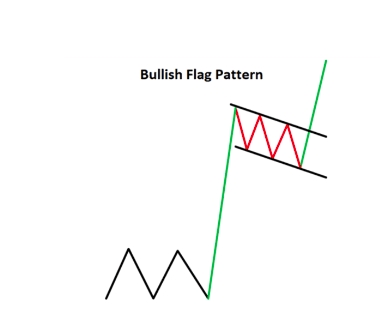
Bullish Flag
In a bullish flag, the stock price rises sharply during the initial trend move and then consolidates in a narrow support and resistance channel.
Once the price breaks the resistance trendline of the flag on strong volumes, it is expected to resume its previous bullish trend. This is the point where a trader who wants to trade this pattern would enter the stock.
The price target for a bull flag is calculated by measuring the length of the flag pole and projecting it from the breakout levels. For example, if the stock rises from Rs 100 to Rs 125 in the flagpole phase and then breaks out around Rs 120, a trader can expect another Rs 25 rise (size of the flag pole). Hence, the position’s price target would be Rs 145 (Rs 120 + Rs 25).
Bearish Flag
In a bearish flag, the original trend is bearish. Hence, the price has fallen sharply before forming the flag. Here, the trader waits for the price action to break the support trendline with significant volumes to make an entry on the short side.
Similar to the bullish flag, the expected target is calculated by measuring the length of the flagpole and projecting it from the breakout levels on the support trendline.

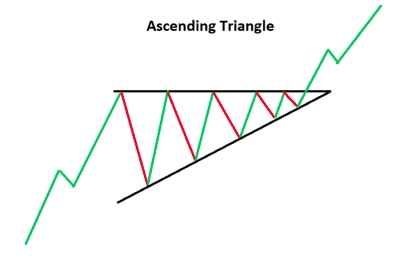
Ascending Triangle
Ascending Triangles are bullish continuation patterns, where in the original trend, the prices have seen a near-vertical rise. During the consolidation phase, the resistance levels remain identical, as indicated by a flat resistance trendline, while the support keeps moving up, as seen from the ascending support trendline.
As the price action continues, the two trendlines are expected to converge, forming a Triangle.
Breakout takes place when the price action breaks the resistance trendline. The price target is calculated by taking the Triangle’s height at its thickest point and adding it to the breakout point.
For example, if the thickest part of the Triangle is Rs 20 high, add Rs 20 to the upside breakout point to get the price target.
Descending Triangle
Descending Triangles are bearish continuation patterns, where in the original trend, the prices have seen a near-vertical fall. The Triangle is formed once a virtually flattish support trendline converges with the descending resistance trendline.
Breakout takes place once the price breaks the support trendline on strong volumes. Just like the Ascending Triangle, the price target is calculated by taking the Triangle’s height at its thickest point and adding it to the breakout point.

Pennant pattern
Pennants are similar to triangle patterns, but unlike triangle patterns, the triangles are symmetrical. This means that in the consolidation phase, resistance levels decline as indicated by a downward sloping resistance trendline, while the support levels rise as seen from the upward sloping support trendline.
The small symmetrical Triangle is preceded by a strong, near-vertical trend that can be bullish or bearish.
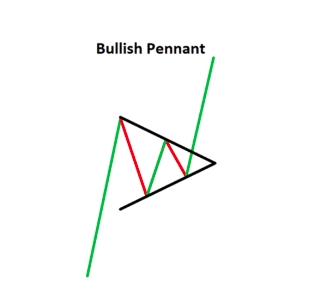
Bullish Pennant
Bullish Pennants are continuation patterns that form in a strong uptrend. The height of the strong uptrend is called a flagpole, followed by a period of consolidation. The bullish trend is expected to resume once the price breaks out from the resistance trendline on strong volumes.
Similar to bull flags, the price target is calculated by measuring the length of the flagpole and projecting it from the breakout point. For example, if the flagpole signifies a Rs 50 upmove, add another Rs 50 from the breakout point to get the price target for Bullish Pennants.
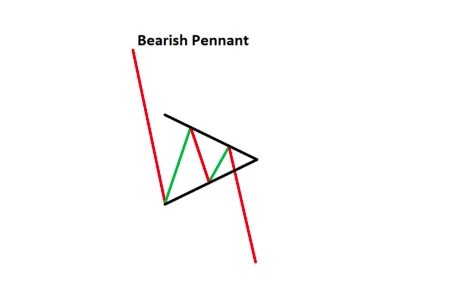
Bearish Pennant
Bearish Pennants are almost similar to Bullish Pennants, except the original trend is bearish. Here, the flagpole signifies the steep decline in prices, followed by a period of consolidation. The bearish trend is expected to resume once the price breaks out from the support trendline on strong volumes. Hence, traders look to enter short trades on a break below the pennant.
Like the Bullish Pennants, the price target for Bearish Pennants is the length of the flagpole measured in terms of the price change.
Related Articles

