- Offerings
- Tools & Platforms
Tools & Calculators
- Open API
- Calculators
- SIP Calculator
- CAGR Calculator
- Compound Interest Calculator
- FD Calculator
- RD Calculator
- EPF Calculator
- Retirement Calculator
- HDFC SIP Calculator
- Mutual Fund Return Calculator
- Lumpsum Calculator
- Step Up SIP Calculator
- ETF SIP Calculator
- Brokerage Calculator
- Equity Margin Calculator
- SWP Calculator
- EMI Calculator
- MTF Calculator
- Pricing
- SKY Learn
- Mutual Funds
- Margin Trading
- Financial Planning
- Personal Finance
- Share Trading
- IPO
- Derivatives
- Currencies
- Intraday Trading
- Trading Strategies
- Demat Account
- Commodity
- ETF
- What is a Cup and Handle Pattern?
- What Does Cup and Handle Indicate?
- Formation of the Pattern
- How to Trade Cup and Handle Pattern?
- Advantages of Cup and Handle Pattern
- Limitations of Cup and Handle Pattern
- Trading Strategies for Cup and Handle Pattern
- Common Mistakes to Avoid in Cup and Handle Pattern
- Conclusion
- FAQs on Cup and Handle Pattern
What is a Cup and Handle Pattern & How to Trade Cup and Handle Pattern?
By HDFC SKY | Updated at: Oct 3, 2025 07:39 PM IST
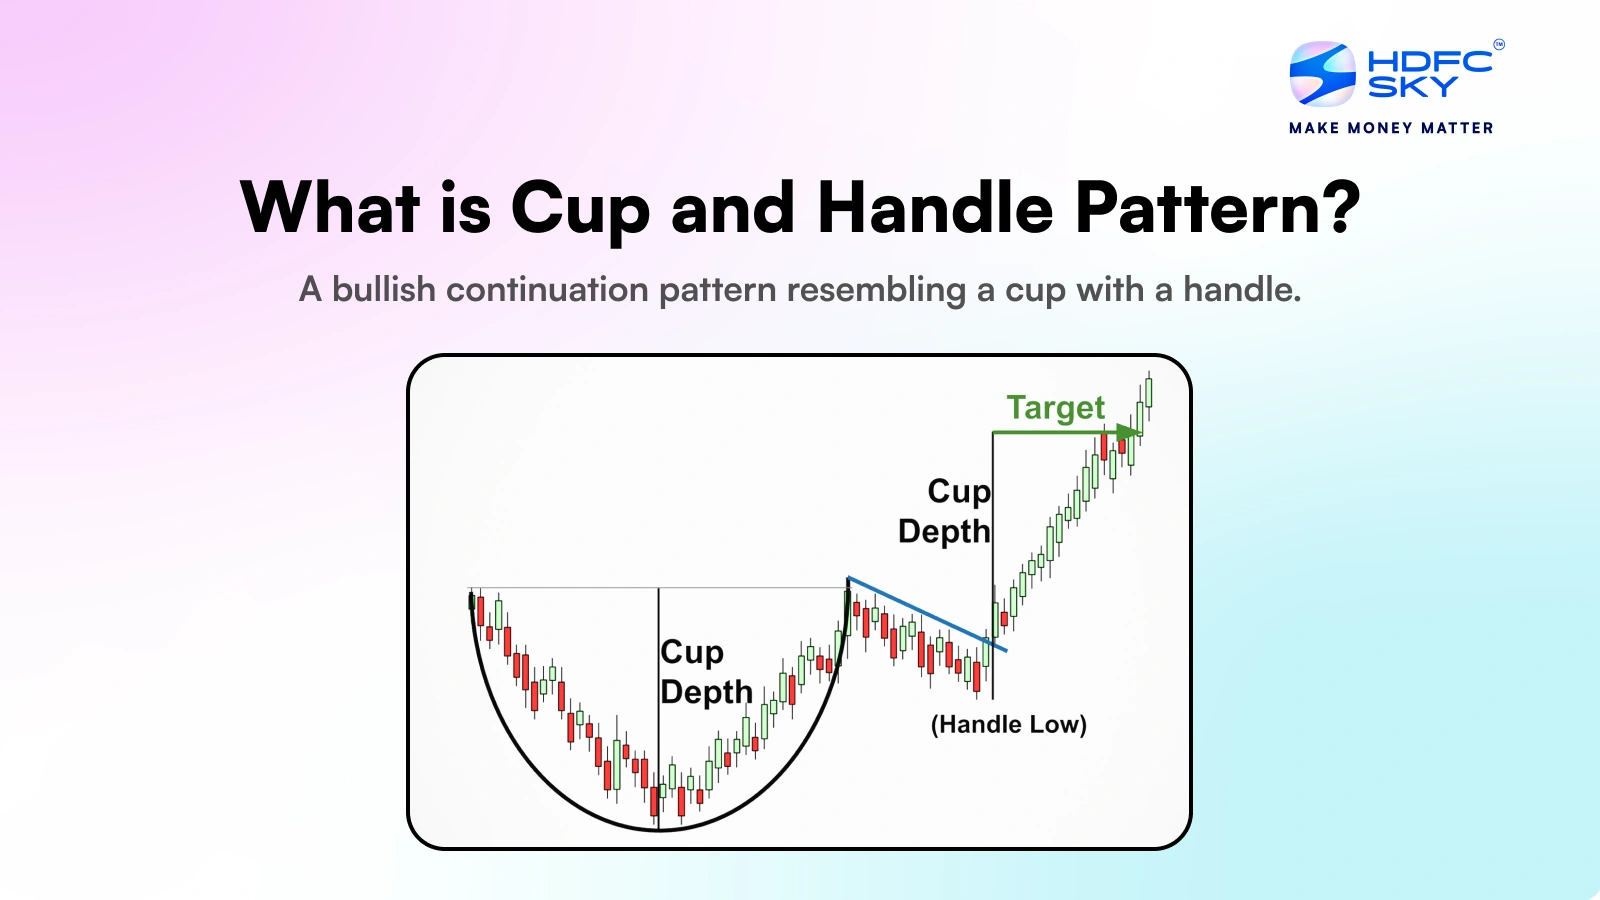
The Cup and Handle pattern is a popular bullish continuation chart pattern used in technical analysis. It resembles the shape of a tea cup where the “cup” forms a rounded bottom and the “handle” is a short consolidation phase that follows. Traders often use this pattern to identify potential breakout opportunities in an uptrend.
What is a Cup and Handle Pattern?
The “cup and handle pattern” is a bullish continuation pattern that often emerges during periods of price consolidation. This pattern is distinguished by a cup-like formation followed by a minor consolidation creating the handle. The cup typically represents a temporary downturn in price, succeeded by a gradual recovery, while the handle indicates a brief dip before the price resumes its ascent.
Traders commonly compare the chart pattern cup and handle to a teacup with a handle, giving rise to its name. While this pattern is predominantly seen in stocks, it can appear in other financial instruments like commodities, currencies and indices. Notably the cup and handle pattern tends to be the most reliable when identified on longer-term charts, such as daily or weekly timeframes.
What Does Cup and Handle Indicate?
The trading cup and handle stock pattern is an essential bullish continuation signal in technical analysis. It provides valuable information regarding possible future price trends and the prevailing market sentiment.
- The Cup: This phase represents a period of consolidation in which the stock price initially rises, then retraces to form a rounded bottom resembling a cup. The cup often forms after an uptrend and may occur near previous highs where the price encounters resistance. The duration of the cup formation can vary but it represents a period of consolidation.
- The Handle: After forming the cup, the stock price typically undergoes a slight downward or sideways movement, creating a short-lived period of consolidation. This “handle” phase indicates a momentary pause in the upward momentum, potentially due to profit-taking or a brief period of uncertainty. However it also indicates underlying strength, as buyers remain interested despite the temporary lull.
Formation of the Pattern
The formation of the cup and handle pattern is divided into several components. Here’s how to identify a cup and handle pattern.
1. The Cup
The cup constitutes the initial segment of this pattern and takes on a “U” shape. It signifies a phase in which the price has reached its lowest point and starts to recover once more, paralleling the earlier decline. This stage signals stabilisation and sets the foundation for a potential bullish continuation.
2. The Handle
Following the cup, the handle forms with a slight downward or sideways movement in price, representing a smaller consolidation phase.
The handle is generally smaller than the cup and typically retraces a portion of the cup’s advance. A common guideline is that the handle retraces no more than one-third of the cup’s height, suggesting a temporary pause rather than a trend reversal.
Note that volume is key to confirming the cup and handle pattern. Ideally, volume decreases as the cup forms and remains low during the formation of the handle, indicating a lack of selling pressure. A surge in volume on breakout validates the pattern, supporting a bullish continuation.
How to Trade Cup and Handle Pattern?
Trading the cup and handle chart pattern involves several strategic steps that aim to capitalise on this bullish continuation signal. Here is how you can effectively trade the cup and handle stock formation, depicted with an example:
- Identify the Cup Formation: Identify a rounded “U” shape on the chart, signifying a consistent and gradual recovery. For example, if a stock steadily decreases to a low of ₹15,000 and subsequently ascends back to approximately ₹20,000, it creates the appearance of a cup.
- Confirm the Handle Formation: A minor pullback after the cup, showing a slight decline or consolidation. It’s typically shorter and shallower compared to the cup.
- Entry Point: Enter a long position when the price breaks above the resistance level formed by the handle. If the handle peaks at ₹21,000, place a buy order slightly above this level.
- Stop Loss and Take Profit: Set a stop loss slightly beneath the lowest point of the handle and take profit by adding the depth of the cup to the breakout level.
- Volume Confirmation: Confirm that the breakout occurs with significant volume, as this validates the strength of the pattern and the probability of continued upward movement.
- Monitor Price Action: Keep monitoring the price action closely to protect profits as the stock price rises.
Advantages of Cup and Handle Pattern
This pattern is favored by traders for its ability to signal strong bullish trends with defined trading levels.
- Bullish Continuation Signal: Helps identify potential upward breakouts during ongoing trends.
- Clear Entry Point: The breakout above the handle provides a specific buy trigger.
- Widespread Use: Recognised by many traders, increasing its effectiveness through collective market behavior.
- Risk Management Friendly: Offers defined stop-loss levels just below the handle.
Limitations of Cup and Handle Pattern
While useful, the Cup and Handle pattern isn’t foolproof and comes with certain drawbacks:
- False Breakouts: The breakout after the handle may fail in volatile or weak markets.
- Subjective Shape: Identifying the perfect “cup” and “handle” can be subjective.
- Time-Consuming: The pattern can take weeks or months to fully form, delaying trades.
- Not Always Reliable: It requires volume confirmation and may not work well in sideways markets.
Trading Strategies for Cup and Handle Pattern
This pattern helps traders spot potential breakouts with manageable risk. Here are common strategies:
- Buy on Breakout: Enter when the price breaks above the resistance formed at the cup’s rim, ideally with strong volume.
- Set a Stop-Loss: Place a stop-loss just below the handle’s low to limit downside risk in case of a failed breakout.
- Measure the Target Price: Estimate the target by measuring the depth of the cup and adding it to the breakout point.
- Wait for Confirmation: Look for volume surge or bullish candlesticks after breakout for confirmation before entering the trade.
- Use in Conjunction with Indicators: Combine with RSI, MACD or moving averages to improve accuracy and reduce false signals.
Common Mistakes to Avoid in Cup and Handle Pattern
Avoiding common errors can help traders make better decisions with this pattern. Awareness of these pitfalls ensures more reliable and profitable trades.
- Misidentifying the Pattern: Confusing other chart shapes with a true cup and handle can lead to poor trades. Ensure the cup has a smooth, rounded bottom and the handle forms a slight downward consolidation.
- Ignoring Volume: Not checking for volume confirmation during the breakout can cause false signals. Look for increased volume as the price breaks above the handle resistance.
- Entering Too Early: Jumping in before the handle completes or the breakout confirms often results in losses. Wait for a clear breakout with volume support.
- Neglecting Stop Loss: Failing to set a stop loss below the handle can increase risk if the breakout fails. Always manage risk effectively.
- Overlooking Market Context: Ignoring overall market trends or news can cause misjudgment; this pattern works best in bullish or stable markets.
Conclusion
The “cup and handle” pattern gives traders a dependable approach to pinpoint potential bullish continuations within the stock market. Trading the “cup and handle” involves waiting for the handle to form entirely and entering a long position upon a breakout above the handle’s resistance. This breakout is typically accompanied by increased volume, confirming the pattern’s strength and the likely continuation of the upward trend.
Related Articles
FAQs on Cup and Handle Pattern
Could a cup and handle pattern be bearish?
The Cup and Handle is a bullish continuation pattern that indicates a period of consolidation followed by a breakout. This pattern is split into two main segments: the cup and the handle. Following an upward trend, the cup takes shape, resembling a bowl with a rounded bottom.
Can a cup and handle pattern fail?
Yes, like any trading pattern, the cup and handle can fail. Failures may occur due to insufficient volume during the breakout, sudden market reversals, or incorrect pattern identification. Traders should always use stop-loss orders to manage risks associated with pattern failures.
Is a cup and handle a bullish pattern?
Yes, the cup and handle is a bullish chart pattern used in trading to predict the continuation of a prevailing uptrend. It’s recognised by its unique ‘cup’ formation followed by a smaller ‘handle’, indicating consolidation before a breakout.
What is the success rate of a cup and handle pattern?
The success rate of a cup and handle pattern can vary widely, but it is generally considered a reliable formation when confirmed with high trading volume and proper market conditions. Detailed statistical analysis is needed for precise success rates.
What is the target price for the cup and handle?
You can calculate the target price for a cup and handle pattern by simply measuring the height of the cup, the distance between the bottom and the top of the cup and then adding this to the breakout price. This calculation provides a projected price at which traders might consider taking profits.
How accurate are cup and handle patterns?
The accuracy of cup and handle patterns depends on proper identification and market conditions. High-volume breakouts and correct pattern formation enhance reliability. Still, traders should always consider additional technical indicators for confirmation to learn how to avoid false signals in cup and handle trades.
How do you avoid fake cups and handle patterns?
To avoid fake cup and handle patterns, traders should ensure the pattern forms with appropriate characteristics, like a well-rounded cup and a handle that doesn’t dip excessively. Also, a breakout with significantly increased volume can help confirm the authenticity of the pattern.

