- Offerings
- Tools & Platforms
Tools & Calculators
- Open API
- Calculators
- SIP Calculator
- CAGR Calculator
- Compound Interest Calculator
- FD Calculator
- RD Calculator
- EPF Calculator
- Retirement Calculator
- HDFC SIP Calculator
- Mutual Fund Return Calculator
- Lumpsum Calculator
- Step Up SIP Calculator
- ETF SIP Calculator
- Brokerage Calculator
- Equity Margin Calculator
- SWP Calculator
- EMI Calculator
- MTF Calculator
- Pricing
- SKY Learn
- Mutual Funds
- Margin Trading
- Financial Planning
- Personal Finance
- Share Trading
- IPO
- Derivatives
- Currencies
- Intraday Trading
- Trading Strategies
- Demat Account
- Commodity
- ETF
- What is a Descending Triangle Pattern?
- How to Identify a Descending Triangle Pattern?
- Advantages and Disadvantages of Descending Triangle Patterns
- How to Trade a Descending Triangle Pattern?
- Descending Triangle Pattern Breakout Strategy
- Descending Triangles with Heikin-Ashi Charts
- Descending Triangle with Moving Averages
- Descending Triangle Reversal Pattern: Top
- Descending Triangle Reversal Pattern: Bottom
- Descending Triangles vs. Ascending Triangles
- How to Measure a Descending Triangle?
- Conclusion
- FAQs on What is Descending Triangle Pattern?
Descending Triangle Pattern: What It Is & What It Indicates?
By HDFC SKY | Updated at: Jul 31, 2025 05:36 PM IST
Summary
- The Descending Triangle Pattern is a bearish continuation pattern used in technical analysis to identify potential price breakdowns.
- It forms when lower highs converge toward a horizontal support line, indicating sellers are gradually overpowering buyers.
- This pattern is especially useful in downtrending markets, signaling that the bearish trend may continue once support is breached.
- Traders typically look for a breakout below the support line, confirming a strong sell signal.
- Volume analysis plays a key role—decreasing volume during formation and a spike on breakout adds credibility to the pattern.
- The entry point is usually just below the support level, with stop-loss placed above the last lower high.
- Target price is calculated by measuring the height of the triangle and subtracting it from the breakout point.
- Ideal for short-selling strategies and risk-managed intraday or swing trades.
- The article emphasizes discipline, confirmation, and proper risk management when applying this strategy.
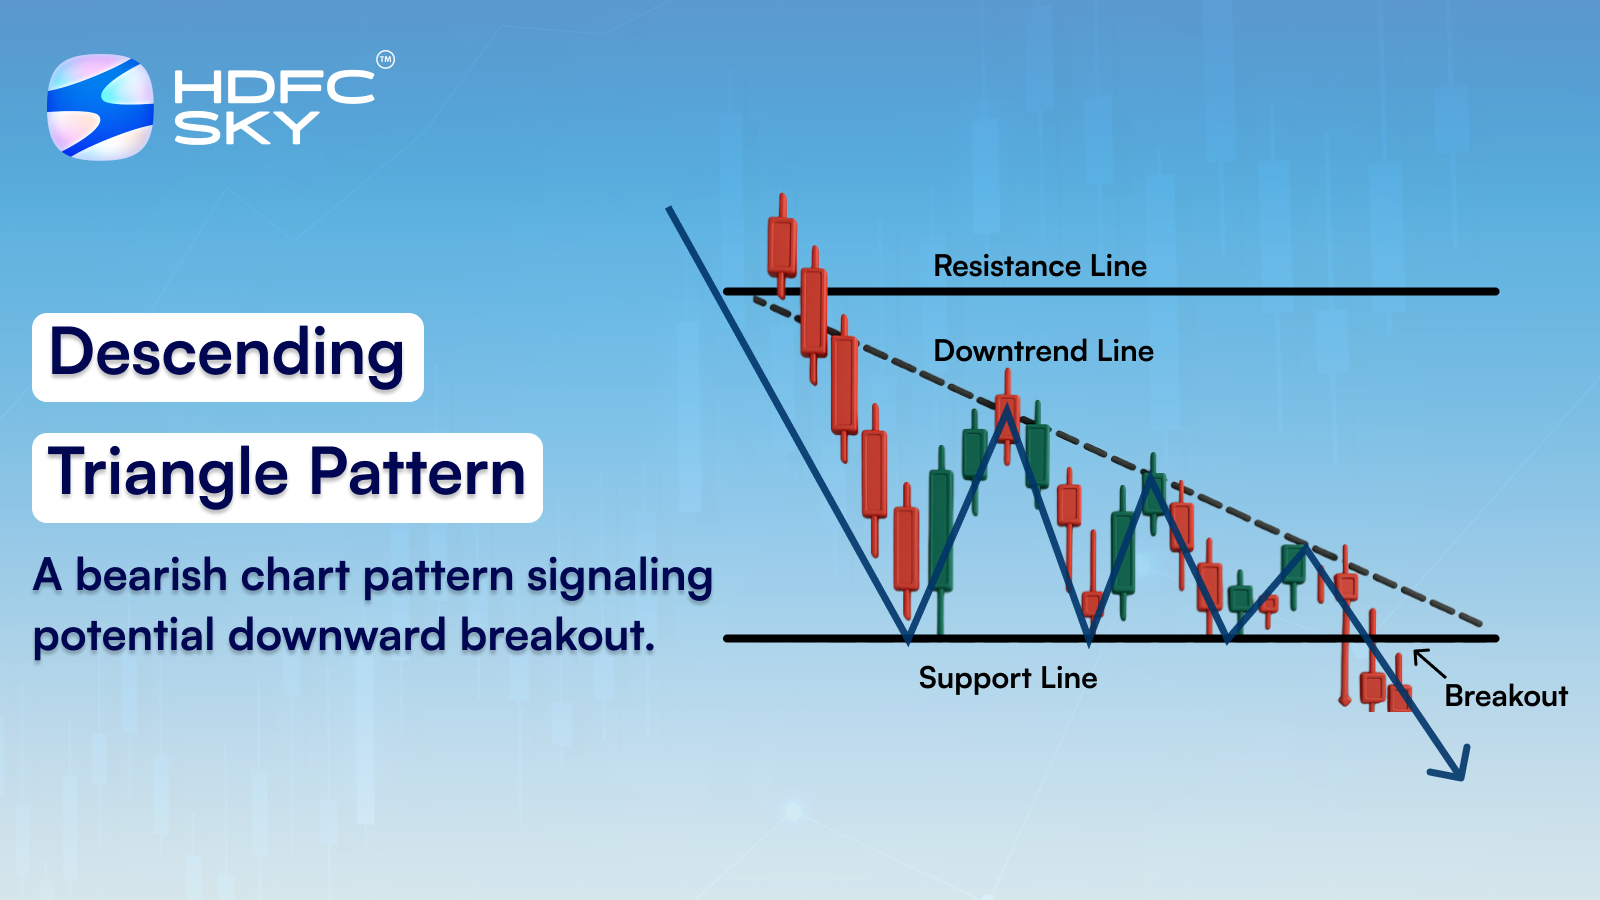
The descending triangle pattern is a bearish chart formation that appears during a downtrend or as a continuation pattern in a consolidating market. It is formed by a series of lower highs that connect to create a descending trendline, while the support level remains relatively flat. This shape creates a triangle that “descends” toward the support level. Traders interpret the descending triangle pattern as a signal that selling pressure is increasing, and a breakdown below support may lead to a further price drop. It’s commonly used to anticipate potential breakout points, set stop-loss levels, and plan entry or exit strategies in trades.
What is a Descending Triangle Pattern?
A descending triangle pattern is a bearish formation that typically appears during an overall downtrend. Characterised by a descending upper trendline and a relatively horizontal support line, this pattern signals that the sellers are in control. They steadily push prices lower while buyers defend a consistent support level.
Once a breakdown occurs, technical traders can aggressively push the price even lower for their benefit over a brief period. However, it is not exclusively bearish. In some rare cases, a breakout in the opposite direction can occur. The breakout in the opposite direction is also known as Reversal Pattern.
For example, a company’s stock showcases a descending triangle pattern. However, if the company unexpectedly announces strong earnings and a promising new product, increased buying pressure might push the price above the descending resistance. This rare bullish breakout defies the usual pattern, highlighting that market dynamics and fundamental shifts can occasionally reverse the anticipated trend.
The descending triangle pattern is a valuable tool for traders. It indicates a probable trend continuation or occasional reversals. Thus, recognising the descending triangle symbol on your charts can be instrumental in shaping your trading strategy.
How to Identify a Descending Triangle Pattern?
Identifying a descending triangle pattern involves a keen observation of price action. Descending triangle chart pattern forms when sellers dominate, creating lower highs while buyers hold a consistent support level.
- The pattern is formed by drawing a downward-sloping line that connects a series of lower highs and a near-horizontal line that marks consistent support.
- One effective approach is to observe candlestick formations closely. Understanding how to spot a descending triangle in candlestick patterns is a common inquiry among traders seeking clarity on entry and exit points.
- Traders identify a descending triangle by looking for multiple touches of the downward resistance and horizontal support lines. This repeated testing suggests buyers maintain a floor while sellers gradually push prices lower. Technical indicators like volume can further confirm the pattern: declining volume on each successive high may reinforce the bearish sentiment.
- Additionally, combining the descending triangle pattern with other tools, such as oscillators, can help validate the likelihood of a breakout, ensuring that trading decisions are well-informed and timely.
Advantages and Disadvantages of Descending Triangle Patterns
Before using the descending triangle pattern trading strategy, one must be aware of its advantages and disadvantages. Let’s take a look at them:
| Advantages | Disadvantages |
| Easy to identify due to its clear structure and defined lines. | Possibility of false breakouts that may expose traders to unexpected losses. |
| Provides a defined support level that aids in setting precise stop-loss orders and managing risk. | It can be misinterpreted, especially during periods of high market volatility. |
| Offers reliable signals for short-selling opportunities during established downtrends. | It may sometimes signal a potential reversal, creating uncertainty about the trend’s continuation. |
How to Trade a Descending Triangle Pattern?
Trading a descending triangle pattern requires a blend of technical analysis and disciplined risk management. When the pattern is confirmed, many traders position themselves for a breakout in the direction of the prevailing trend-typically to the downside.
For those wondering how to trade a descending triangle, the strategy often involves waiting for a decisive move below the horizontal support line and then entering a short position with a well-defined stop-loss order. It is crucial to monitor the pattern’s evolution closely. Traders should look for a surge in volume accompanying the breakout, which can confirm the pattern’s strength.
Additionally, incorporating other technical indicators, such as the Relative Strength Index (RSI) or Moving Averages, can provide extra assurance that the trend will continue. By combining these elements, traders can optimise their entries and exits, making the most of the signals provided by the descending triangle pattern.
Descending Triangle Pattern Breakout Strategy
A successful descending triangle pattern breakout strategy focuses on the critical moment when the price decisively falls below the support line. Once this breakout occurs, traders often anticipate a further decline and use it as a signal to initiate short positions. A common approach is to measure the distance between the upper trendline and the support line, then project this distance downward from the breakout point to estimate potential profit targets.
This strategy involves confirming the breakout with increased volume, as a surge in trading activity typically supports the move. Some traders may also wait for a retest of the broken support line, which now acts as resistance, to secure a more favourable entry point.
With clear exit rules and stop-loss levels based on the pattern’s structure, the descending triangle pattern breakout strategy can be an effective tool in a trader’s arsenal.
Descending Triangles with Heikin-Ashi Charts
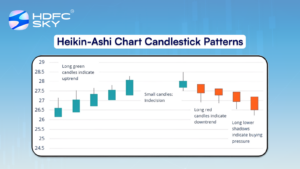
Using Heikin-Ashi charts to analyse a descending triangle pattern can smooth out price fluctuations and provide a clearer picture of the trend. Heikin-Ashi candles, by averaging price data, reduce market noise and highlight the underlying trend more effectively than traditional candlestick charts.
For traders, this means that spotting the formation of a descending triangle can become less ambiguous, especially in volatile markets. By combining Heikin-Ashi with traditional technical analysis, traders can monitor and manage their entries and exits in a more planned manner.
The clean visual representation helps to confirm whether the bearish sentiment is building up steadily or if there might be a potential reversal. This method is particularly beneficial when trying to avoid false signals and enhances the overall reliability of the descending triangle chart pattern analysis.
Descending Triangle with Moving Averages
Integrating moving averages with a descending triangle pattern provides an additional layer of confirmation. Moving averages can help to filter out short-term price fluctuations and confirm the direction of the trend. When the price consistently trades below a key moving average, it reinforces the bearish bias the descending triangle indicates.
Traders often use a combination of short-term and long-term moving averages to pinpoint trend reversals or continuations. For instance, if the 50-day moving average is trending downward and the price remains confined within a descending triangle, it strengthens the case for a further decline. This combination allows traders to refine their entries and exits, making the overall strategy more robust.
Descending Triangle Reversal Pattern: Top
The top of a descending triangle can sometimes act as a reversal point if the price fails to breach the horizontal support. In such cases, the pattern may signal an impending change in market sentiment. Traders might observe a tapering off of selling pressure near the top of the pattern, indicating that the bearish momentum is weakening. This scenario often called a descending triangle pattern reversal, suggests that buyers could soon step in.
Risk management becomes even more critical when a reversal is anticipated at the top. Traders are advised to look for additional confirmation through oscillators or divergence patterns. Recognising the descending triangle pattern reversal at the top can provide opportunities for long positions, especially when market conditions start to favour a bullish turnaround.
Descending Triangle Reversal Pattern: Bottom
Conversely, the bottom of a descending triangle pattern can also present reversal signals. After a sustained downtrend, this scenario unfolds when the price shows signs of stabilisation at the support level.
As the descending triangle matures, a prolonged bounce from the support line might indicate that selling pressure diminishes, potentially paving the way for a bullish reversal. Traders should look for divergence in momentum indicators or a sudden increase in buying volume as the price approaches the support.
Such signals can validate a descending triangle pattern reversal at the bottom, prompting traders to consider exiting short positions or entering long positions. This dual potential makes the pattern versatile in a trader’s technical analysis toolkit.
Descending Triangles vs. Ascending Triangles
While descending triangles and ascending triangles are common chart patterns, they carry distinct implications for market direction.
| Descending Triangle | Ascending Triangle |
| Typically forms in a downtrend, signalling a continuation of bearish momentum. | Generally appears in an uptrend, indicating continuation of bullish momentum. |
| Characterised by lower highs and a horizontal support line. | Marked by higher lows and a horizontal resistance line. |
| Generally breaks downward, confirming selling pressure. | Typically breaks upward, affirming buyer strength. |
| Reflects a market where sellers gradually dominate while buyers defend a fixed support level. | Reflects a market where buyers steadily push prices higher while sellers cap price advances. |
| Traders often place stop-loss orders above the descending resistance. | Traders usually place stop-loss orders below the ascending support. |
This contrast means each pattern requires different trading strategies and risk management approaches. Understanding the difference between descending triangles and ascending triangles is crucial for traders, especially when determining whether to short or long based on the specific descending triangle pattern observed on the chart.
How to Measure a Descending Triangle?
Measuring a descending triangle pattern involves determining the vertical distance between the initial high (at the top of the pattern) and the horizontal support line. This distance can then be projected downward from the breakout point to estimate a target price. This method, sometimes called the pattern’s “height measurement,” provides traders with a clear idea of the potential move following a breakout.
Careful measurement helps set realistic profit targets and manage risk through stop-loss orders. Adjusting for market volatility and confirming the measurement with additional technical indicators is essential. This analytical approach ensures that the descending triangle pattern is identified and quantified, allowing traders to plan trades with greater precision and confidence.
Conclusion
The descending triangle pattern is a versatile tool in technical analysis, offering traders a window into market sentiment during downtrends. From identifying its classic structure to integrating Heikin-Ashi charts and moving averages, understanding this pattern can significantly enhance trading strategies.
While it presents clear entry and exit points, its inherent risks such as false breakouts demand disciplined risk management. For stock market traders in India, mastering the nuances of the descending triangle pattern can be a valuable step toward more informed and strategic trading.
Related Articles
FAQs on What is Descending Triangle Pattern?
Is the descending triangle pattern bullish or bearish?
The descending triangle pattern is generally considered bearish due to its structure, where lower highs are formed against a steady support level. This formation typically indicates that sellers are in control, suggesting a continuation of the downtrend.
What should traders watch for when trading a descending triangle?
Traders should closely monitor volume changes, the strength of the support line, and the number of touches along the descending resistance line. A significant surge in volume during a breakout enhances the pattern’s reliability.
Can the price break out in the opposite direction in a descending triangle?
Yes, although rare, the price can break out in the opposite direction of the expected move. While the descending triangle pattern is predominantly bearish, an unexpected bullish reversal can occur if buying pressure unexpectedly increases.
Can descending triangles occur in different time frames?
Absolutely, descending triangle patterns can form on various time frames, from intraday charts to daily and weekly charts. The pattern’s reliability can vary with time; longer-term patterns generally provide stronger signals due to more data points.

