- Offerings
- Tools & Platforms
Tools & Calculators
- Open API
- Calculators
- SIP Calculator
- CAGR Calculator
- Compound Interest Calculator
- FD Calculator
- RD Calculator
- EPF Calculator
- Retirement Calculator
- HDFC SIP Calculator
- Mutual Fund Return Calculator
- Lumpsum Calculator
- Step Up SIP Calculator
- ETF SIP Calculator
- Brokerage Calculator
- Equity Margin Calculator
- SWP Calculator
- EMI Calculator
- MTF Calculator
- Pricing
- SKY Learn
- Mutual Funds
- Margin Trading
- Financial Planning
- Personal Finance
- Share Trading
- IPO
- Derivatives
- Currencies
- Intraday Trading
- Trading Strategies
- Demat Account
- Commodity
- ETF
DOW Theory in Technical Analysis
By HDFC SKY | Updated at: Apr 8, 2025 03:19 PM IST

Summary
Technical analysts use various charts and tools to analyse the market and trade in different type of market conditions. They apply different theories and strategies that have been developed over years to make the best possible trades.
The base of technical analysis is the Dow Theory.
The Dow Theory is a trading approach developed by Charles Dow, the founder of Dow-Jones Financial News Service (Wall Street Journal). Dow wrote a series of editorials and articles on markets between the years 1900-1902.
After his death in 1902, William Peter Hamilton continued the work and compiled all these articles. In 1932, Robert Rhea collectively published the writings of these two men as the Dow Theory.
According to the Dow Theory, the stock market is a reliable measure of the overall business environment in an economy, and investors can gauge the health of business conditions by analysing the stock market.
Dow Theory explains that the market moves in trends. Thus, if one of its averages rises above the previous important high, followed by a similar rise in the other averages, the prediction according to Dow Theory would be that the market is in an upward trend.
The theory assumes that the market discounts everything consistent with the efficient markets hypothesis. Also, different market indices must confirm each other in terms of price action and volume patterns until the trend reverses.
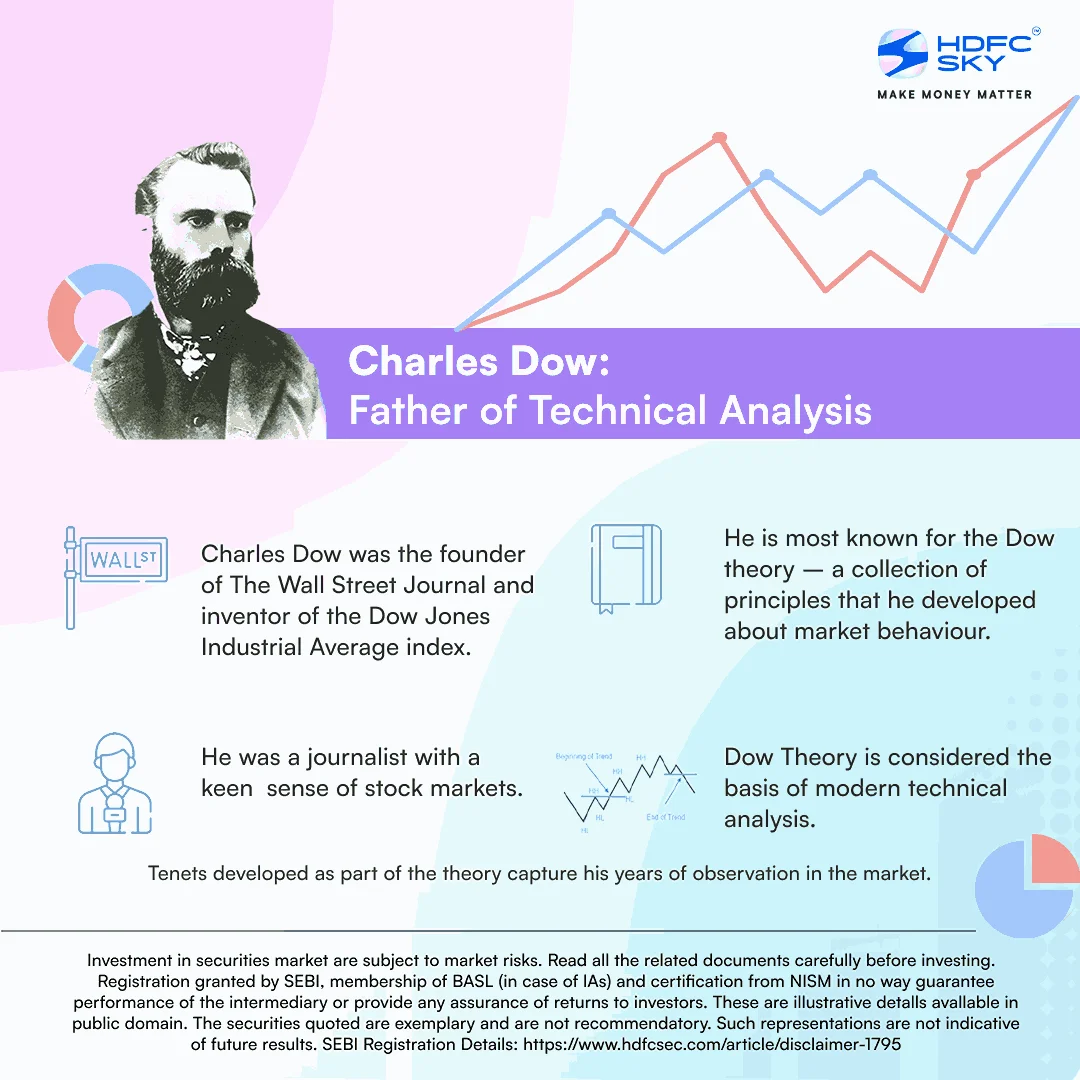
The Dow Theory is built on six beliefs called the Tenets, developed by Charles Dow based on his observations of the markets over the years. These are:
1. Market discounts everything
This belief explains that every information or news that is known or unknown to the public is already priced in or discounted by the indices or reflected in the stock price. This information can be any news, development or data that holds the potential to impact the stock price or market. These include corporate earnings, economic growth, and inflation numbers, among others.
2. There are three market trends
The Dow Theory was the first to propose that the market moves in trends. It says that there are three kinds of market trends – Primary Trend, Secondary Trend and Minor Trend.
Primary Trend – This is a major trend that indicates how the market moves in the long term. The primary trend could last for many years. It signifies the broader multi-year market direction.
Long-term investors look for the primary trend in the market. Remember, the primary trend can be a primary uptrend or a primary downtrend.
Secondary Trend – Secondary trend is like an opposite movement to the primary trend and is considered a correction to the primary trend. A correction in a bull market, or recovery in a bear market, can be termed a secondary trend. These minor counter-reactions or trends can last between a few weeks to a few months.
Minor Trends –Minor trends are the daily fluctuations that take place in the market. These could be in the opposite direction to the secondary trend. Minor trends can last for less than a couple of weeks. Analysts term minor trends as market noise.
3. Primary trends have three phases
According to the Dow Theory, the primary trend passes through three phases: accumulation phase, public participation phase and excess phase. In a bear market, these phases are called distribution phase, public participation phase, and panic (or despair) phase.
In a starting phase of a bull (or bear) market, the traders buy (or sell) stocks contrary to the common market view. This is the beginning of the primary upward (or downward) trend in a bull (or bear) market and is known as the accumulation (or distribution) phase.
Following this, more investors enter the market and trade as per prevailing sentiment. This is the public participation phase where the market sees more investor participation within the prevailing trend. This impacts the stock prices in the market.
Near the end of the broader primary trend, the excess or panic phase sets in, which is marked by excessive buying or selling by investors.
4. Indices must confirm each other
According to the Dow Theory, a trend cannot be established by just one index. All other indices must confirm each other and reflect a similar direction. For instance, in India, if the market is in a bullish trend, all the indices, such as Nifty, Nifty Midcap, and Nifty Smallcap, among others, should reflect a similar uptrend. It would be impossible to determine the bullish trend just by the movements shown by the Nifty index.
5. Volumes must confirm the trend
As per the Dow Theory, volumes too, must support the trend. Trading volumes should increase if the prices are moving in the direction of a primary trend, while volumes must decline if the prices are moving against the trend. It is believed that low volume signals weakness in the trend.
For example, in an uptrend, the volumes must increase with rising prices, while the volumes should decrease with the fall in prices. In the same way, in the downward trend, the volumes should rise with falling prices, and decrease with a rise in prices.
6. Trends continue until a clear reversal occurs
According to the theory, the primary trend persists despite noise or temporary blips. The secondary phase or a short-term opposite reaction may show up but the market continues to move on the lines of the primary trend till a clear and definite reversal is seen.
During an uptrend, a temporary reversal or correction is possible, but the market will continue to move higher in line with the long-term trend. However, until a clear reversal is confirmed, the market will maintain the status quo on the trend.
Charles Dow relied fully on the closing price of the stock or index and did not worry about intraday movements. Dow Theory believes that the closing price is most sacred, and it is that price which signals the trend. From among the open, high, low and close figures, the Dow Theory believes that only the closing price represents the final evaluation of the stock during the day.
The Dow Theory also provides an idea of line ranges. As per the theory, there are periods of consolidation or horizontal price movements, which traders should wait out for, for the price movement to break the trend line, before reaching any conclusion on the market’s direction.
Related Articles

