- Offerings
- Tools & Platforms
Tools & Calculators
- Open API
- Calculators
- SIP Calculator
- CAGR Calculator
- Compound Interest Calculator
- FD Calculator
- RD Calculator
- EPF Calculator
- Retirement Calculator
- HDFC SIP Calculator
- Mutual Fund Return Calculator
- Lumpsum Calculator
- Step Up SIP Calculator
- ETF SIP Calculator
- Brokerage Calculator
- Equity Margin Calculator
- SWP Calculator
- EMI Calculator
- MTF Calculator
- Pricing
- SKY Learn
- Mutual Funds
- Margin Trading
- Financial Planning
- Personal Finance
- Share Trading
- IPO
- Derivatives
- Currencies
- Intraday Trading
- Trading Strategies
- Demat Account
- Commodity
- ETF
Dual Candlestick Chart Patterns
By HDFC SKY | Updated at: Apr 8, 2025 03:19 PM IST
Summary
Now that we have understood single-candlestick formations, let us take it a step further and look at dual-candlestick patterns on the price charts. A single candlestick shows the investor sentiment during that particular market session and helps identify trading opportunities within that session.
On the other hand, dual candlestick patterns signal the changes in trend and show how sentiments changed over the previous session. Let us see how each pattern signals a trend change by taking examples from real price charts.
Here are some of the popularly used dual-candlestick patterns observed on actual price charts in 2022
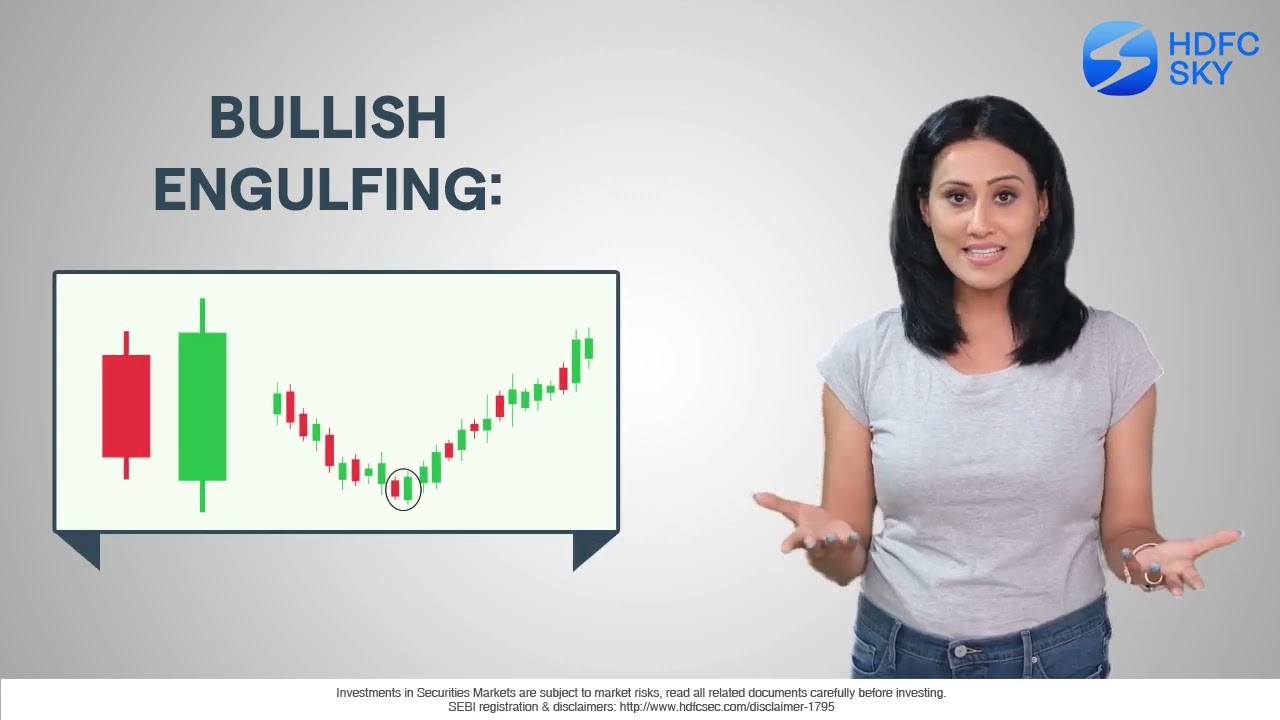
Bullish Engulfing
This pattern typically forms at the end of a stock’s downtrend. The first candlestick is bearish with its closing price greater than or equal to the next day’s opening price. The second candlestick is bullish, and its closing price surpasses the previous day’s opening price, thus ‘engulfing’ the previous day’s candlestick.
This pattern indicates that the trend will now reverse from bearish to bullish, and the stock price is likely to rise from here.
Here are two instances when the bullish engulfing appeared on the daily charts of Bajaj Auto Ltd in January 2022 and February 2022 respectively.
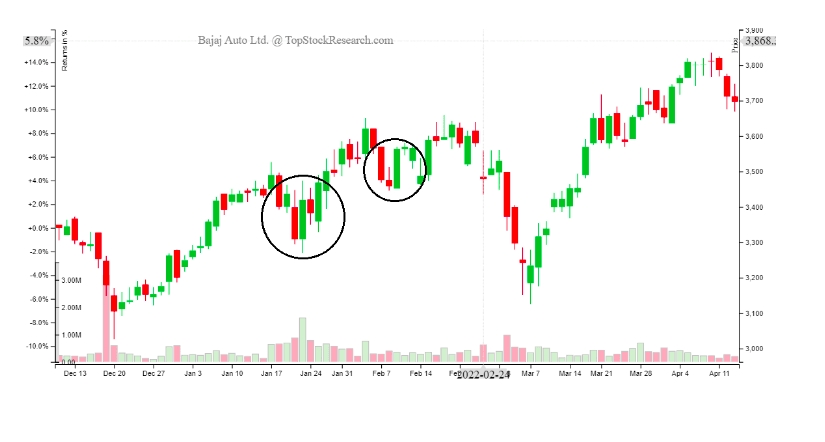
Notice how both appeared when a downtrend was ending and later showed an upward trend. This pattern can be ignored if it appears anywhere else other than at the bottom of a downtrend.
Bearish Engulfing
This pattern is usually observed at the peak of an uptrend or a price rally. In this case, the first candlestick is bullish, with its closing price lesser than or equal to the next day’s opening price. It is followed by the second bearish candlestick whose closing price falls below the opening price of the previous day, thus ‘engulfing’ the previous day’s candlestick.
This indicates that the trend will reverse from bullish to bearish, and the stock price might fall from here.
Here’s an instance from the same stock wherein a bearish engulfing was observed in April 2022:
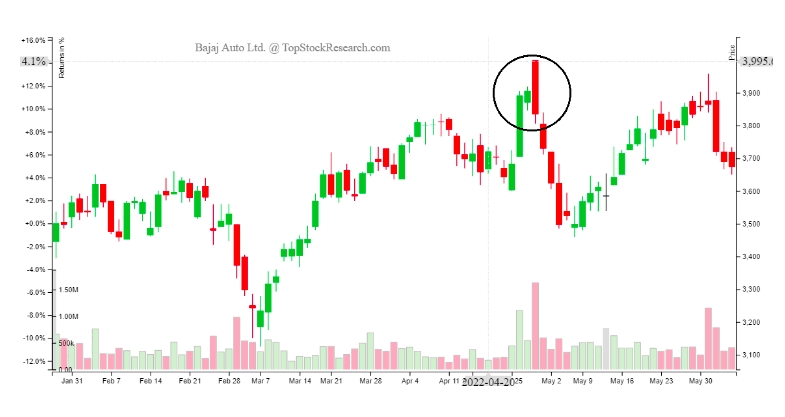
Now, if you notice, the pattern appeared at the peak of a price rally and was followed by a strong downfall. If this pattern appears anywhere other than at the top of an uptrend, it can be ignored.
Dark Cloud Cover
The dark cloud cover can be thought of as a minor variation of the bearish engulfing pattern. In this case, the second candlestick engulfs anywhere between 50-100% of the first candlestick and retains the same set-up as the bearish engulfing.
This pattern also indicates a potential trend reversal from bullish to bearish market sentiment.
Here’s how the dark cloud cover appeared on the price chart of Amy Organics Ltd in April 2022.:

Notice how the partial bearish engulfing forms the dark cloud cover, after which the price does not drastically fall, but remains subdued for nearly three weeks. It eventually shows a strong bearish engulfing before dropping drastically.
Bullish Harami
Think of the bullish harami as the bullish engulfing with the two candlesticks interchanged, i.e., a long and bearish first candlestick is followed by a short and bullish second candlestick. This means that the day 2 opening price is higher than the day 1 closing price and the day 2 closing price is lower than the day 1 opening price. Confused?
Take a look at this occurrence from March 2022 on the daily price chart of Dalmia Bharat Ltd.
Replace the chart. Not the ideal one. Take the second candle a bit smaller one than previous.
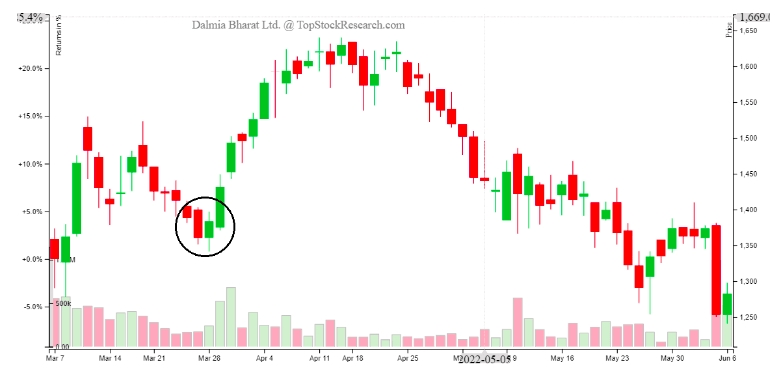
This also appears at the bottom of a downtrend and indicates a trend reversal from bearish to bullish. Notice how the bullish harami makes way for a significant uptrend. If this appears anywhere else other than at the bottom of a downtrend, the pattern can be ignored.
Bearish Harami
Just as the bullish harami is the bullish engulfing with the candlesticks swapped, the bearish harami is the bearish engulfing with the same swapping. So, a long bullish first candlestick is followed by a short bearish second candlestick. Hence, the Day 2 opening price is lower than the Day 1 closing price, and the Day 2 closing price is higher than the Day 1 opening price. Hard to imagine again?
We’ve got you. Take a look at this bearish harami on the daily price chart of Action Construction Equipment Ltd from April 2022.

Notice how the bearish harami showed up at the end of an uptrend and led to a downtrend. If this appears anywhere else other than at the top of a price rally, you can ignore it.
Candlestick patterns are only indicators of possible trend changes. That is why it is crucial to know when a particular formation is of importance and when it is not. As an investor or a trader, you should not rely solely on candlestick patterns as it may be incomplete information. Researching a company thoroughly and following its developments regularly can significantly reinforce your trading decisions.
Related Articles

