- Offerings
- Tools & Platforms
Tools & Calculators
- Open API
- Calculators
- SIP Calculator
- CAGR Calculator
- Compound Interest Calculator
- FD Calculator
- RD Calculator
- EPF Calculator
- Retirement Calculator
- HDFC SIP Calculator
- Mutual Fund Return Calculator
- Lumpsum Calculator
- Step Up SIP Calculator
- ETF SIP Calculator
- Brokerage Calculator
- Equity Margin Calculator
- SWP Calculator
- EMI Calculator
- MTF Calculator
- Pricing
- SKY Learn
- Mutual Funds
- Margin Trading
- Financial Planning
- Personal Finance
- Share Trading
- IPO
- Derivatives
- Currencies
- Intraday Trading
- Trading Strategies
- Demat Account
- Commodity
- ETF
- What is Elliott Wave Theory?
- History of Elliott Wave Theory
- How Elliott Wave Theory Works?
- Importance of Elliott Wave Theory
- How can Indian Traders Use Elliott Wave Theory?
- Rules to Identify Elliott Wave Theory
- Corrective Waves in Elliott Wave Theory
- Is Elliott Wave Theory Foolproof?
- Elliott Wave Theory vs Other Methods
- Conclusion
- FAQs on Elliott Wave Theory
What is Elliott Wave Theory & How Can Indian Traders Use Elliott Wave Theory?
By HDFC SKY | Updated at: Oct 13, 2025 10:53 AM IST
The Elliott Wave Theory is a technical analysis concept that helps traders understand market trends through repetitive wave patterns. Developed by Ralph Nelson Elliott this theory suggests that financial markets move in predictable cycles or “waves” influenced by investor psychology. These waves reflect both bullish and bearish market sentiments making the Elliott Wave Theory a powerful tool for forecasting price movements and identifying trading opportunities.
What is Elliott Wave Theory?
Elliott Wave Theory is a technical analysis tool that explains how prices move in financial markets based on crowd psychology. It states that market prices follow repetitive cycles or “waves” driven by investor sentiment. According to the theory a complete market cycle consists of 5 impulse waves in the direction of the trend and 3 corrective waves against it, forming an 8-wave pattern.
History of Elliott Wave Theory
Elliott published his theory of market wave patterns in the 1930s after studying 75 years of charts.
In 1935 Elliott came to prominence after he predicted that stock prices had bottomed out after the multi-year crash caused by the Great Depression. The theory has become a reliable tool for traders and investors across the world since then.
Traders must keep in mind that these patterns do not predict specific price action or movements in the future but only provide a probable scenario of stock price behaviour.
Elliott waves can be used in combination with other technical analysis tools or indicators to predict market movements and identify trading opportunities.
How Elliott Wave Theory Works?
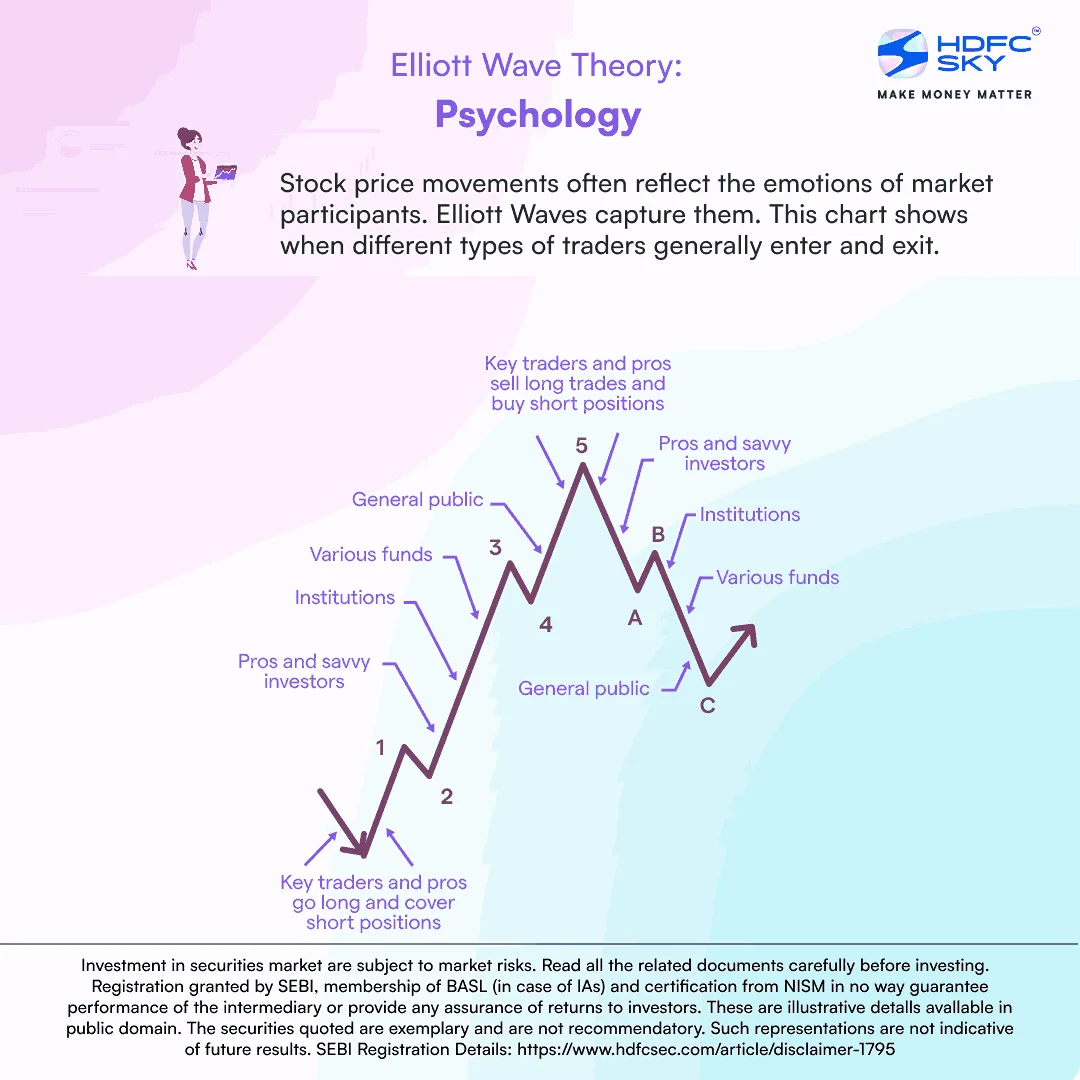
According to the Elliott Wave theory, stock prices move in recurring, up and down, patterns called waves ( fractal in nature) that are created by investor sentiment or psychology.
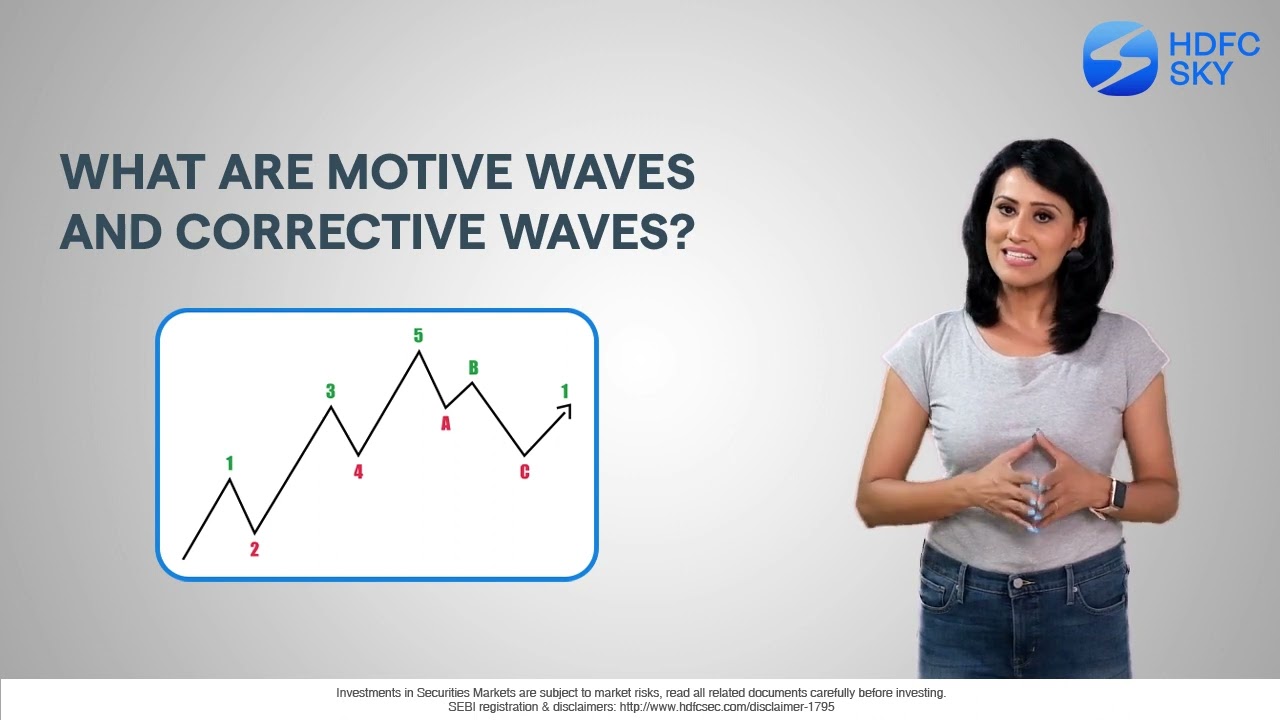
The theory says that there are two types of waves: motive waves (also called impulse waves) and corrective waves. Motive or impulse waves are movements that take place in the direction of a trend, while corrective waves occur in the opposite direction of the ongoing trend.
Each motive wave moves in the direction of the main trend. This means that if the market is in an uptrend, we will see an upward trending motive wave.
Each motive wave consists of five sub-waves, three of which are in the direction of the main trend, while two are in the opposite direction. Once this five-wave phase has appeared, the motive wave will be considered complete.
In the above chart the three sub-waves 1, 3 and 5 advance and move in the same direction as the main trend. While the other two sub-waves 2 and 4, move in the opposite direction.
Importance of Elliott Wave Theory
Elliott Wave Theory is crucial for understanding market trends and predicting future price movements. It helps traders and investors make informed decisions by analysing market psychology through wave patterns.
- Identifies recurring patterns in market cycles.
- Helps forecast potential price directions.
- Improves timing for buying and selling.
- Provides insight into market sentiment shifts.
- Supports both short-term and long-term trading strategies.
How can Indian Traders Use Elliott Wave Theory?
Indian traders can apply Elliott Wave Theory to analyse Nifty, Bank Nifty, stocks and commodities by identifying market trends and reversals across timeframes.
- Identify Trend Direction: Spot 5-wave impulse patterns to follow the market’s primary trend.
- Time Entry & Exit Points: Use wave counts to enter during Wave 2 or 4 and exit around Wave 5.
- Multi-Timeframe Analysis: Analyse both short-term and long-term charts (like daily and weekly).
- Combine with Technical Indicators: Enhance accuracy by using RSI, Fibonacci retracements and volume.
- Risk Management: Apply stop-loss below wave patterns to reduce loss from invalid counts.
Tip: Always practice on historical charts and refine wave counting skills before using them in live trades.
Rules to Identify Elliott Wave Theory
Motive waves are identified with the following rules:
- Wave 2 cannot retrace more than 100% of wave 1. This means that the bottom of wave 2 will be higher than the bottom of wave 1.
- Wave 3 can never be the shortest of the three upward-trending waves 1, 3 and 5
- The bottom of wave 4 cannot be below the top of wave 1
The pattern will not be considered a motive wave if any of these rules are violated.
In a bull market a motive wave will take the stock price upwards, while a corrective wave would reverse the trend. On the other hand in a bear market, a motive wave would take the stock price lower, while a corrective wave will push the stock price higher. Hence the Elliott waves diagram would be inverted in a bear market.
Corrective Waves in Elliott Wave Theory
Corrective waves (also called diagonal waves) consist of a combination of three sub-waves that make the movement in the opposite direction of the preceding motive wave. Corrective waves also move the market in the direction of the trend.
A corrective wave consists of three sub-waves. Each sub-wave does not fully retrace the previous sub-wave. Also, the third sub-wave of the corrective wave may not be the shortest wave.
The corrective wave is depicted in the above chart as a three-wave structure. It has sub-waves labelled as waves A, B and C.
Both waves A and C are in direction opposite of the previous motive wave (i.e. downward if it appears after an upward motive wave and vice versa). Wave B is in the opposite direction of the corrective trend. The appearance of all three waves will complete the pattern of the corrective wave.
The whole combination of this motive wave and corrective wave illustrates the Elliott Wave cycle.
Is Elliott Wave Theory Foolproof?
Elliott Wave Theory is a powerful tool for understanding market cycles but it is not foolproof. Market behavior can be unpredictable and wave patterns may not always follow textbook rules.
While the theory helps identify potential market directions, its interpretation is subjective and requires experience. Traders should combine it with other technical indicators and risk management to make informed decisions, rather than relying solely on Elliott Waves. Unexpected news and market emotions can disrupt predicted patterns so caution is essential.
Elliott Wave Theory vs Other Methods
Elliott Wave Theory is a pattern-based forecasting tool, while other methods like Moving Averages RSI or MACD are indicator-based. Each has unique advantages.
| Aspect | Elliott Wave Theory | Other Methods (e.g., RSI, MA, MACD) |
| Basis | Price patterns and psychology | Price and volume data |
| Type | Predictive | Reactive |
| Complexity | High: needs skill in wave counting | Moderate to simple |
| Ideal For | Trend forecasting and reversals | Entry/exit confirmation |
| Timeframe Use | Suitable for long and short-term analysis | Mostly short to medium-term |
| Subjectivity | High: open to interpretation | Lower: based on fixed formulas |
Conclusion
The Elliott Wave Theory remains one of the most insightful tools for understanding market psychology and predicting potential price movements. By studying repetitive wave patterns, traders can gain a deeper understanding of market trends, corrections and investor behaviour. However since wave counting can be subjective and influenced by market volatility, the theory should be used alongside other technical indicators for confirmation. With practice and proper risk management, Elliott Wave Theory can help traders identify high-probability trading setups and make more confident and informed market decisions.
Related Articles
FAQs on Elliott Wave Theory
What are the 5 waves of Elliott Wave Theory?
The theory consists of 5 waves: Waves 1, 3, and 5 are impulse waves (in the direction of the trend), while Waves 2 and 4 are corrective.
What are Waves 1, 3, and 5 called?
Waves 1, 3, and 5 are known as impulse waves, representing the movement in the direction of the overall trend.
Is Elliott Wave a good strategy?
Elliott Wave can be effective for experienced traders who understand market psychology, but it requires practice and is not foolproof.
What are the two types of waves in Elliott Wave Theory?
According to the Elliott Wave Theory, there are two types of waves: motive waves (also called impulse waves) and corrective waves. Motive waves move in the direction of the main trend, while corrective waves move in the opposite direction of the ongoing trend.
What are the rules for identifying a motive wave?
What are the rules for identifying a motive wave?
- The rules for identifying a motive wave are:
- Wave 2 cannot retrace more than 100% of wave 1.
- Wave 3 can never be the shortest of the three upward-trending waves (1, 3, and 5).
- The bottom of wave 4 cannot be below the top of wave 1.
- If any of these rules are violated, the pattern will not be considered a motive wave.

