- Offerings
- Tools & Platforms
Tools & Calculators
- Open API
- Calculators
- SIP Calculator
- CAGR Calculator
- Compound Interest Calculator
- FD Calculator
- RD Calculator
- EPF Calculator
- Retirement Calculator
- HDFC SIP Calculator
- Mutual Fund Return Calculator
- Lumpsum Calculator
- Step Up SIP Calculator
- ETF SIP Calculator
- Brokerage Calculator
- Equity Margin Calculator
- SWP Calculator
- EMI Calculator
- MTF Calculator
- Pricing
- SKY Learn
- Mutual Funds
- Margin Trading
- Financial Planning
- Personal Finance
- Share Trading
- IPO
- Derivatives
- Currencies
- Intraday Trading
- Trading Strategies
- Demat Account
- Commodity
- ETF
Falling Window Candlestick Pattern, Learn How to Trade With It?
By HDFC SKY | Updated at: Jul 24, 2025 06:11 PM IST
- Definition: The Falling Window Candlestick Pattern is a bearish continuation pattern, commonly found in technical analysis, indicating strong selling momentum.
- Formation: It occurs when a candlestick opens below the previous candle’s low and stays unfilled—creating a visible “gap down” or “window”.
- Market Sentiment: Suggests aggressive selling and a negative market bias; often seen during downtrends or heightened bearish pressure.
- Trading Implication: Traders interpret this as a strong signal to continue short positions or initiate new sell trades, particularly if confirmed by high volume and other technical indicators.
- Confirmation Needed: Effectiveness increases when followed by further price drops, bearish candlesticks, or if supported by volume spikes and trend indicators like moving averages or RSI.
- Risk Management: Stop-loss orders are typically placed above the upper boundary of the window to manage risk.
- Use in Strategy: Often integrated into momentum and trend-following strategies for enhanced decision-making in bearish markets.
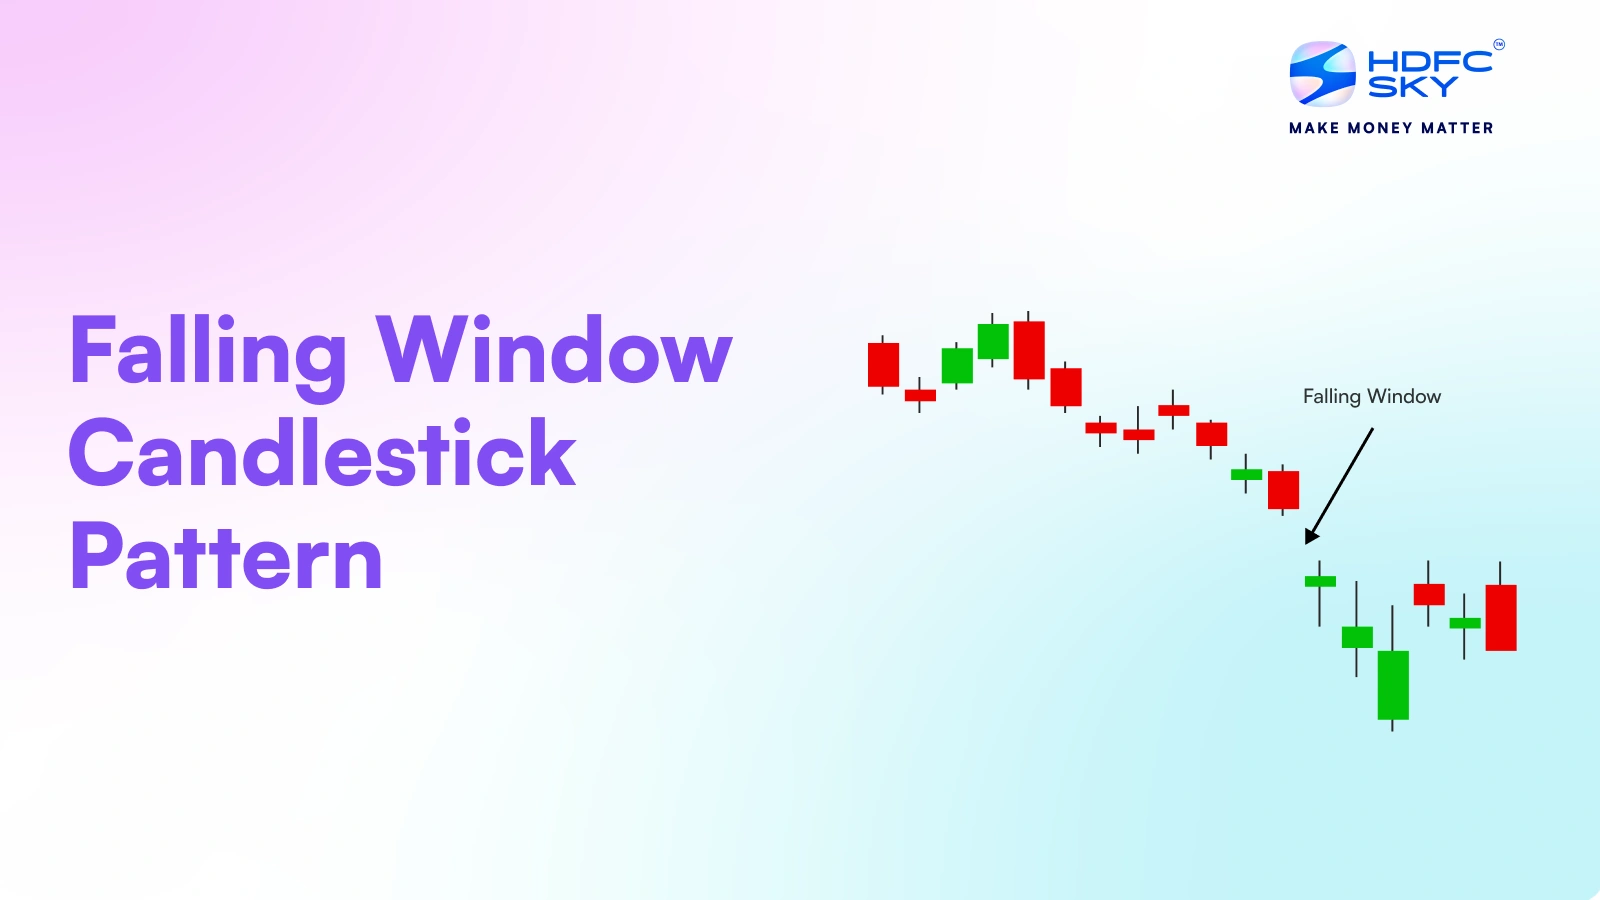
Falling window candlestick pattern is a two candlestick pattern. This pattern indicates continuation of a bearish trend. There is gap between the low price of the first candle and the high price of the second candle in this pattern.
The Falling Window candlestick pattern is one of the most effective indicators for traders hoping to profit from significant bearish trends. A trader’s strategy can be greatly improved by identifying this pattern and knowing how to trade it successfully.
Whether you’re new to trading or an experienced investor, the Falling Window pattern is an essential tool for identifying continued price declines.
What is the Falling Window Candlestick Pattern?
The Falling Window candlestick pattern is a bearish pattern that occurs when the price of security gaps down significantly, signalling that selling pressure is continuing. It forms when a candlestick opens lower than the previous one and often leads to a further downward movement in price.
The gap between the two candlesticks (the first being a large bearish candle and the second opening below the previous one) indicates strong bearish momentum. This pattern, which is frequently used to spot the continuation of a downward trend, indicates that sellers are still in power and that market sentiment is still negative.
In a downtrend, the Falling Window pattern typically marks the beginning of a new leg down, which might present fantastic short-position chances.
How to Identify the Falling Window Candlestick Pattern
Identifying the Falling Window candlestick pattern is essential for capitalising on downward price movements. Here’s how you can recognise it:
- Look for a Downtrend: The Falling Window is most effective when it occurs in the context of a strong downtrend. The market must already be in a bearish phase for this pattern to be valid.
- Gap Down: After a large bearish candlestick, the next candlestick should open lower than the previous one. This creates the gap that is the defining feature of the Falling Window pattern.
- Follow-Through Movement: The second candlestick should not close above the first candlestick’s low. It should continue to close lower, reinforcing the downward movement.
- Confirm with Volume: Ideally, the Falling Window should be accompanied by increased volume, which confirms the strength of the bearish trend.
When you see these elements combined, you can be confident that the Falling Window Candlestick Pattern is forming, and the market is likely to continue its downward movement.
What Does the Falling Window Candlestick Pattern Tell Traders?
The Falling Window candlestick pattern is a clear signal of bearish continuation. It tells traders that the downward momentum will likely continue after the gap, and the market will likely head lower. This pattern suggests that buyers are not able to push prices higher, and sellers are still in control of the market.
Traders have a certain likelihood of entering short bets when they see the Falling Window pattern. Because the gap indicates significant bearish sentiment, it is occasionally viewed as a signal to sell or take advantage of the slump.
How to Trade the Falling Window Candlestick Pattern
Traders must employ various tactics and ideas to successfully trade the Falling Window candlestick pattern. Some trading techniques that can improve this pattern’s success are listed below.
Strategy 1: Pullbacks Or Retracements
One tactic is to watch for a retracement or pullback once the Falling Window has developed. After the initial decline, prices may briefly reverse before continuing their downward trajectory. Traders can wait for the price to pull back to a key level, such as the previous low or a moving average, before entering short positions.
Strategy 2: Trading the Falling Window With Support Levels
Support levels are the price points below which the price is not going. Trading strategies can be made around the support level when a falling window pattern has emerged.
Strategy 3: Trading the Falling Window With Moving Averages
Moving averages can help confirm the trend. If the Falling Window pattern forms below a significant moving average, such as the 50-day or 200-day moving average, it confirms the strength of the bearish trend. Traders can use moving averages to place stop-loss orders above the moving average and trade in the direction of the gap.
Strategy 4: Trading the Falling Window With RSI Divergences
RSI (Relative Strength Index) divergence occurs when the price moves in one direction while the RSI moves in the opposite direction. If the Falling Window forms along with RSI divergence, it can signal that the market is oversold, and a short position could be a good entry point for traders.
Strategy 5: Trading the Falling Window With Fibonacci retracements
Fibonacci retracements can be used to identify potential reversal levels. After the Falling Window forms, traders can use Fibonacci retracement levels to find areas where the price may pull back before continuing lower. Entering short positions near these levels could provide an excellent risk-to-reward ratio.
Strategy 6: Trading the Falling Window With Pivot Points
Pivot points are significant levels that traders use to identify potential support and resistance. When the Falling Window occurs near a key pivot point, it can indicate that the price is likely to continue lower. Traders can use pivot points to set stop-loss orders and take potential profit levels for their trades.
Market circumstances, volume, and the trader’s approach are some of the variables that affect the Falling Window candlestick pattern’s success rate. When combined with other technical indicators like Fibonacci levels, RSI, or moving averages, the Falling Window has a high success rate in forecasting ongoing bearish action.
But it’s important to keep in mind that no pattern is infallible. Traders should always follow a well-thought-out trading plan and employ appropriate risk management strategies, such as placing stop-loss orders.
Conclusion
The Falling Window Candlestick Pattern is a valuable tool for traders looking to capitalise on bearish trends. By understanding how to identify and trade this pattern, traders can enhance their trading strategies and make informed decisions. Whether you’re a beginner or an experienced trader, recognising the Falling Window pattern and applying the right strategies can provide excellent opportunities to potentially profit from downward price movements.
Related Articles
FAQs on Falling Window Candlestick Pattern
What is the Rising and Falling Window signal?
The Rising Window indicates a bullish continuation pattern, while the Falling Window signals a bearish continuation
How does a Falling Window signal help traders?
The Falling Window pattern may help traders by indicating that the bearish trend may continue. A falling window signal helps traders by indicating a strong bearish trend, allowing them to take advantage of price declines.
What are the limitations of using the Falling Window pattern?
The Falling Window pattern may not always be accurate in its indication.
How accurate is the Falling Window signal?
The accuracy of the Falling Window signal depends on factors such as market conditions, volume, and the trader’s strategy. The accuracy can improve when used in conjunction with other technical indicators, but no pattern is foolproof. Proper risk management is essential.

