- Offerings
- Tools & Platforms
Tools & Calculators
- Open API
- Calculators
- SIP Calculator
- CAGR Calculator
- Compound Interest Calculator
- FD Calculator
- RD Calculator
- EPF Calculator
- Retirement Calculator
- HDFC SIP Calculator
- Mutual Fund Return Calculator
- Lumpsum Calculator
- Step Up SIP Calculator
- ETF SIP Calculator
- Brokerage Calculator
- Equity Margin Calculator
- SWP Calculator
- EMI Calculator
- MTF Calculator
- Pricing
- SKY Learn
- Mutual Funds
- Margin Trading
- Financial Planning
- Personal Finance
- Share Trading
- IPO
- Derivatives
- Currencies
- Intraday Trading
- Trading Strategies
- Demat Account
- Commodity
- ETF
- What is Heikin Ashi?
- How Does Heikin Ashi Work?
- What Does the Heikin Ashi Chart Indicate?
- How to Calculate Heikin Ashi with a Formula?
- How to Read Heikin-Ashi charts?
- What are the Advantages and Disadvantages of the Heikin Ashi Chart?
- Heikin Ashi vs. Traditional Candlestick Charts
- Conclusion
- FAQs on Heikin Ashi Candle Patterns
Heikin Ashi Candle Patterns: How it Works and What it Shows?
By HDFC SKY | Published at: May 28, 2025 12:45 AM IST
Market ‘noise’, the constant minor fluctuations in price – can often confuse traders in the dynamic Indian stock market, making it difficult to identify genuine underlying trends. Technical analysts employ various charting techniques to filter this noise, and one popular method is using Heikin Ashi charts. Unlike conventional candlestick charts, this technique smooths out price movements, offering a clearer visualisation of trends and momentum.
Heikin Ashi candles are widely available on most trading platforms in India used for stocks, commodities, and even cryptocurrencies. Its popularity stems from its ability to help traders focus on the bigger picture by minimising the distraction of random price action, making it a valuable tool for many. Read on to understand the Heikin Ashi meaning and how to use these charts effectively.
What is Heikin Ashi?
Heikin Ashi, a term originating from Japanese, translates to “average bar”. It is a charting technique utilised in technical analysis across Indian financial markets to help identify the prevailing trend direction and potential reversal points more clearly than traditional candlestick charts.
The core idea behind Heikin Ashi candlestick charts is that they modify how price data (Open, High, Low, Close – OHLC) is displayed. Instead of plotting the raw OHLC for each period, Heikin Ashi uses a specific Heikin Ashi formula that averages price data, incorporating values from the previous period. This averaging mechanism smooths out volatility and reduces the impact of minor fluctuations, making underlying trends appear more distinct. The resulting candles are coloured (typically green for up, red for down) to indicate the smoothed trend direction. Many Indian traders favour Heikin Ashi for its visual simplicity and perceived clarity in trend identification across various assets like stocks, futures, and options.
How Does Heikin Ashi Work?
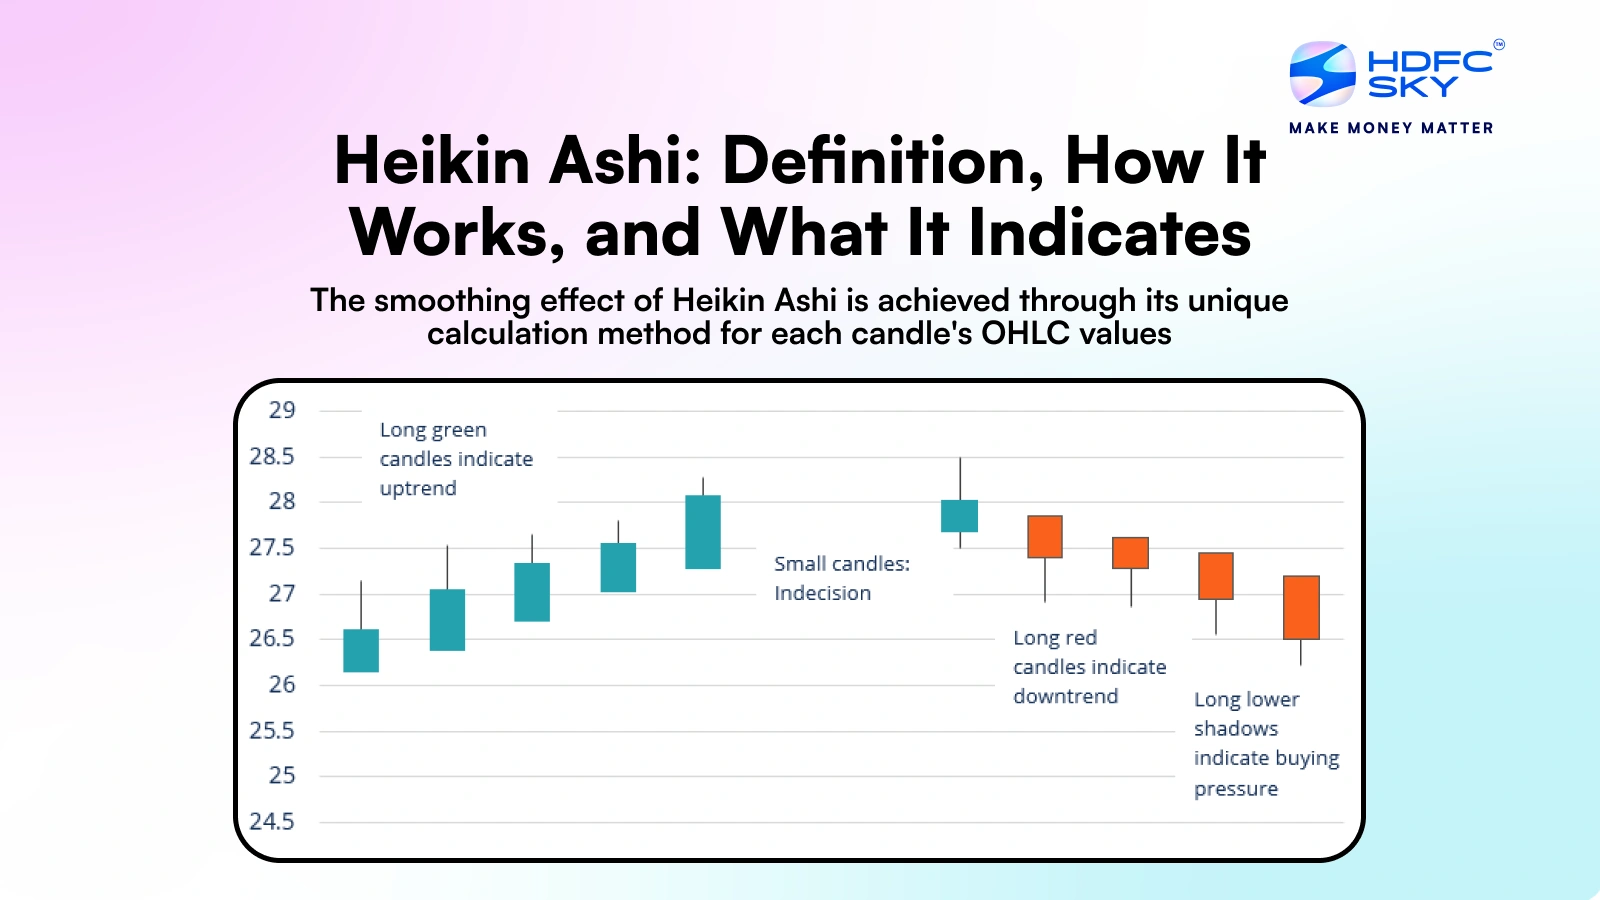
The smoothing effect of Heikin Ashi is achieved through its unique calculation method for each candle’s OHLC values. Unlike standard candles that use the actual OHLC for the period, each Heikin Ashi candle pattern is derived using formulas incorporating data from both the current and the previous period.
Specifically (as detailed in the calculation section), the Heikin Ashi ‘Open’ is based on the midpoint of the previous Heikin Ashi candle’s body, and the Heikin Ashi ‘Close’ is an average of the current period’s raw OHLC. The High and Low are adjusted relative to these calculated HA Open and Close values.
This averaging across periods inherently filters out minor price gaps and fluctuations, resulting in a chart that often displays smoother, more consistent sequences of coloured candles during strong trends (long strings of green candles in an uptrend, long strings of red in a downtrend).
Heikin Ashi patterns, like consecutive candles without lower shadows in an uptrend, are often interpreted as signs of strong momentum. This makes Heikin Ashi strategies particularly popular for swing trading and position trading in India, where identifying and following sustained moves is key. While usable for intraday trading, some traders find its inherent smoothing introduces a slight lag compared to raw price action for very rapid scalping decisions.
What Does the Heikin Ashi Chart Indicate?
A Heikin Ashi chart pattern primarily indicates the smoothed direction and strength of the market trend. It helps traders visually distinguish between trending phases and consolidation or potential reversal phases more easily than standard charts, reducing the likelihood of being ‘shaken out’ by minor counter-trend movements.
- Strong Uptrend: Indicated by a series of long green Heikin Ashi candles, often with no (or very small) lower wicks/shadows. This shows consistent buying pressure where the average price is consistently pushing higher.
- Strong Downtrend: Indicated by a series of long red candles, often with no (or very small) upper wicks. This shows consistent selling pressure.
- Consolidation/Indecision/Potential Reversal: Signaled by smaller candle bodies with wicks appearing on both ends. This indicates a weakening of the previous trend and uncertainty between buyers and sellers. A change in candle colour (e.g., from green to red after an uptrend) can also signal a potential trend reversal that traders watch closely.
Indian traders utilise these Heikin Ashi chart patterns to make more objective decisions about entries, exits, or holding positions based on the perceived strength and direction of the smoothed trend.
How to Calculate Heikin Ashi with a Formula?
The specific Heikin Ashi calculation for each candle uses the OHLC data of the current period and the Heikin Ashi Open and Close of the previous period. The Heikin Ashi formula set is as follows:
- HA Close = (Current Open + Current High + Current Low + Current Close) / 4
- (The average price of the current bar)
- HA Open = (Previous HA Open + Previous HA Close) / 2
- (The midpoint of the previous Heikin Ashi bar’s body)
- HA High = Maximum value among [Current High, Current HA Open, Current HA Close]
- (The highest point reached, considering the HA Open/Close)
- HA Low = Minimum value among [Current Low, Current HA Open, Current HA Close]
- (The lowest point reached, considering the HA Open/Close)
Note that calculating the first Heikin Ashi candlestick requires using the regular OHLC values initially (e.g., HA Open = (Open + Close)/2; HA Close = (O+H+L+C)/4). Subsequent candles use the prior HA values. Thankfully, modern charting platforms used by Indian traders calculate and plot this Heikin Ashi candle formula automatically.
How to Read Heikin-Ashi charts?
Reading Heikin Ashi charts involves interpreting the candle’s colour, body size, and wicks:
- Colour: Green (or white) indicates the average price moved up (HA Close > HA Open); Red (or black) indicates the average price moved down (HA Close < HA Open). Focus on sequences of colours for trend direction.
- Body Size: A long body signifies strong momentum in the direction of the colour. A short body indicates weakening momentum or consolidation.
- Wicks (Shadows): This is key for assessing trend strength:
- Strong Uptrend: Look for green candles with long bodies and no lower wicks. This suggests buyers are strongly in control, pushing price up from the open.
- Strong Downtrend: Look for red candles with long bodies and no upper wicks. This suggests sellers dominate, pushing price down from the open.
- Indecision/Potential Reversal: Candles (often with smaller bodies) showing both upper and lower wicks indicate a balance or struggle between buyers and sellers, potentially signaling consolidation or the start of a trend reversal.
- Trend Change: A change in candle colour, especially after a strong trend, can signal a potential shift in momentum and is often used as an entry or exit trigger in Heikin Ashi strategies.
Reading the Heikin Ashi candle pattern is generally considered quite intuitive, even for newer traders in India.
What are the Advantages and Disadvantages of the Heikin Ashi Chart?
Before using the Heiken Ashi chart to make trading decisions, it is important for you to know its pros and cons.
Advantages:
- Improved Trend Visibility: Smooths price action, making prevailing uptrends and downtrends much easier to identify visually compared to standard candlesticks.
- Noise Reduction: Filters out minor price fluctuations and consolidations, helping traders focus on the more significant trend and avoid reacting to small, potentially misleading moves.
- Clearer Signals (in Trends): Sequences of strong candles (long bodies, minimal counter-trend wicks) provide clear visual cues about trend strength and potential continuation.
- Easier Interpretation: Generally considered simpler to read for identifying overall trend direction compared to interpreting complex candlestick patterns.
- Reduced Trading Stress: The smoother appearance can help reduce the psychological stress associated with volatile price swings, potentially leading to more disciplined trading.
Disadvantages:
- Lagging Indicator: Due to the averaging calculation involving previous period data, Heikin Ashi candles inherently lag behind actual price action. Signals (like colour changes) may appear after a significant portion of the move has already occurred.
- Obscures Actual Prices: The chart does not display the true Open, High, Low, and Close prices for the period. This can mask important price details like actual support/resistance levels tested or price gaps.
- Less Suitable for Scalping/Fast Trading: The lag makes it less effective for strategies requiring very quick entries and exits based on immediate price action, like scalping trading in Indian markets.
- Requires Confirmation: Signals should ideally be confirmed with other indicators (like volume, momentum oscillators) or analysis, as false signals can still occur.
- Averaged Data: Some traders dislike that they are not seeing the ‘raw’ price action, feeling the averaging might hide important nuances.
Heikin Ashi vs. Traditional Candlestick Charts
Here’s a comparison between the traditional candlestick chart and the Heikin Ashi chart to help you understand how they differ:
| Feature | Heikin Ashi Chart | Traditional Candlestick Chart |
| Time Representation | Based on fixed time intervals (like candles), but the candle shape itself incorporates previous period data, smoothing time-based representation. | Strictly based on fixed time intervals (e.g., daily, hourly); each candle independently represents price action only within that specific period. |
| Data Plotted | Plots calculated OHLC values based on averaging current and previous period data, designed to show smoothed trend. | Plots the actual Open, High, Low, and Close (OHLC) prices for each specific time period, reflecting the raw price action. |
| Noise Filtering | Actively filters and smooths minor price fluctuations due to the averaging formula, aiming to present a clearer picture of the underlying trend. | Displays all price movements within the chosen time period, including market noise. Filtering noise requires the trader to interpret patterns and context. |
| Visual Appearance | Typically shows smoother sequences of same-coloured candles during trends, with fewer gaps and less ‘choppy’ appearance compared to standard candlesticks. | Shows distinct candles for each period, clearly depicting the open-close relationship and high-low range, allowing for detailed pattern recognition (Doji, Hammer etc.). |
| Primary Information | Emphasises trend direction and strength through sustained candle colours and the presence/absence of wicks. Signals potential trend changes via colour shifts. | Offers rich detail on intra-period volatility, buying/selling pressure, open-close dynamics, and forms numerous specific patterns indicating sentiment shifts. |
| Typical Use Case (India) | Favoured for trend following, swing trading, and position trading where identifying and staying with the smoothed trend is key. Less suited for scalping. | Highly versatile; used across all timeframes and trading styles (scalping, day trading, swing trading, investing) for detailed price action analysis and pattern trading. |
Conclusion
Heikin Ashi charts offer a unique and valuable perspective for technical analysis in the Indian markets. By averaging price data, Heikin Ashi candles effectively smooth out market noise and provide a clearer visualisation of underlying trends and momentum compared to traditional candlestick charts. This makes the Heikin Ashi candlestick technique particularly useful for trend-following strategies, swing trading, and position trading.
However, traders must be aware of its inherent lag and the fact that it obscures the actual open, high, low, and close prices. Like any tool, Heikin Ashi is best used not in isolation, but in conjunction with other indicators and sound risk management strategies to make well-informed trading decisions.
Related Articles
FAQs on Heikin Ashi Candle Patterns
How do Heikin Ashi and Renko Charts differ from one another?
Heikin Ashi smooths price action using averaging formulas within fixed time intervals (like daily candles). Renko charts disregard time entirely and only draw new ‘bricks’ when the price moves by a predetermined fixed amount, focusing purely on price magnitude changes to show trends.
How much is each bar worth in the Heikin Ashi chart pattern?
Each Heikin Ashi candle represents the average price movement for the chosen timeframe (e.g., one day, one hour). Its specific calculated OHLC values are derived from the Heikin Ashi formula, incorporating data from the current and previous period, rather than representing exact market prices for that single period.
How accurate and reliable is the Heikin Ashi chart?
Heikin Ashi charts are effective for identifying established trends and reducing noise, improving clarity. However, due to the averaging involved, they inherently lag behind actual price changes and can miss sharp, immediate reversals. Their reliability increases when used with other confirming indicators and within trending market conditions in India.
Do professional traders apply Heikin-Ashi?
Yes, many professional traders in India and globally utilise Heikin Ashi charts, particularly for swing and position trading strategies. They value its ability to clearly depict trends and filter noise, but typically use it alongside other technical tools and risk management techniques for confirmation and decision-making.

