- Offerings
- Tools & Platforms
Tools & Calculators
- Open API
- Calculators
- SIP Calculator
- CAGR Calculator
- Compound Interest Calculator
- FD Calculator
- RD Calculator
- EPF Calculator
- Retirement Calculator
- HDFC SIP Calculator
- Mutual Fund Return Calculator
- Lumpsum Calculator
- Step Up SIP Calculator
- ETF SIP Calculator
- Brokerage Calculator
- Equity Margin Calculator
- SWP Calculator
- EMI Calculator
- MTF Calculator
- Pricing
- SKY Learn
- Mutual Funds
- Margin Trading
- Financial Planning
- Personal Finance
- Share Trading
- IPO
- Derivatives
- Currencies
- Intraday Trading
- Trading Strategies
- Demat Account
- Commodity
- ETF
- What is High Wave Candlestick Pattern?
- Formation of the High Wave Candle Pattern
- What Does the High Wave Candlestick Pattern Indicate?
- Importance of High Wave Candlestick Pattern
- How to Interpret the High Wave Candlestick Pattern?
- How to Identify and Trade the High Wave Candlestick Pattern?
- Conclusion
- FAQs on High Wave Candlestick Pattern
What is High Wave Candlestick Pattern in Trading?
By HDFC SKY | Updated at: Jul 24, 2025 06:34 PM IST
Summary
- Topic Focus: The article explains the High Wave Candlestick Pattern, a key signal in candlestick charting used to identify market indecision and potential trend reversals.
- Pattern Characteristics: Features small real bodies with long upper and lower shadows, indicating a tug-of-war between buyers and sellers with no clear direction.
- Market Interpretation: A high wave candle suggests high volatility but uncertainty, often appearing during market consolidation phases or before significant trend changes.
- Trading Strategy:
- Best used in conjunction with support and resistance levels or trend confirmation signals.
- Traders should wait for confirmation (e.g., a strong bullish or bearish candle after the high wave) before entering positions.
- Risk Management: Emphasizes using stop-loss and confirmation tools like volume or technical indicators to avoid false signals.
- Use Case: Valuable for traders looking to anticipate market turning points or identify entry/exit opportunities in volatile conditions.
Technical analysis consists of a wide number of patterns and indicators. As a trader and even as an investor, it is best recommended to be aware of the patterns and indicators that are frequently used in the technical analysis of the stock market, as understanding of the same allows you an extra edge in being well informed about the market trends.
What is High Wave Candlestick Pattern?
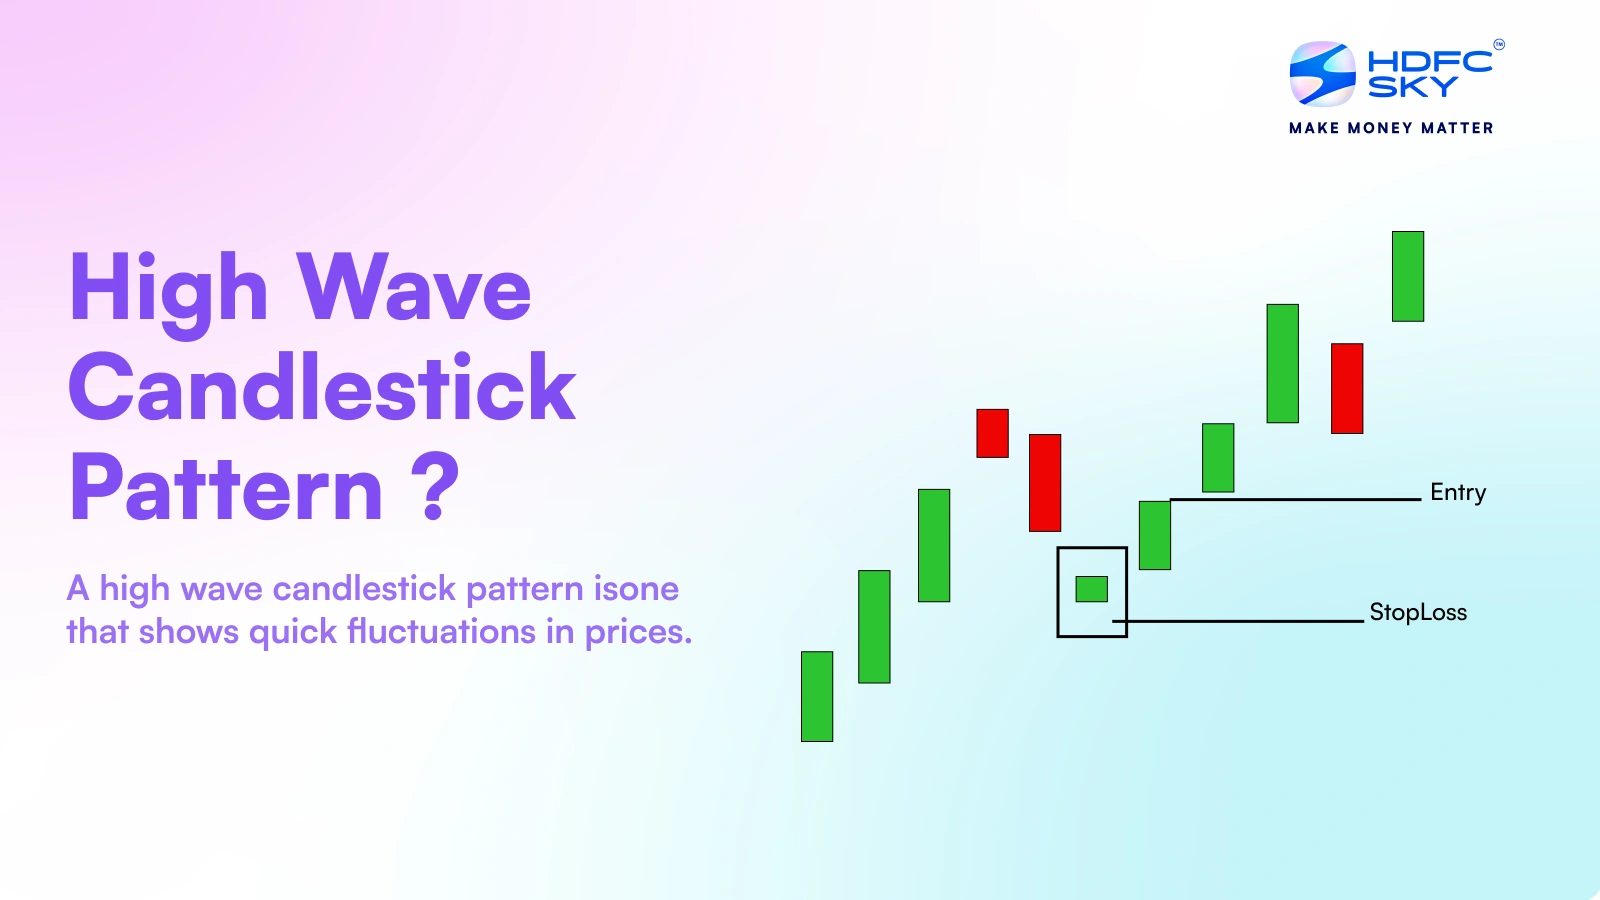
A high wave candlestick pattern is one that shows quick fluctuations in prices. It may indicate a high level of uncertainty in the market. This pattern features long upper and lower wicks with a small real body, indicating that neither buyers nor sellers have firm control. Traders often see it as a potential sign of trend reversal or consolidation, depending on the market context.
Formation of the High Wave Candle Pattern
The high wave candle pattern forms when an asset’s price experiences significant fluctuations during a trading session but closes near its opening price. This results in a candlestick with a small body and extended wicks. The key characteristics of this pattern include
- A small real body, signifying minimal difference between opening and closing prices.
- Long upper and lower shadows represent market volatility and uncertainty.
- It can appear in both uptrends and downtrends.
The high wave pattern visually resembles a spinning top, featuring a small real body and long upper and lower wicks. The extended shadows indicate significant price swings during a trading session, reflecting market indecision. The small body suggests that neither bulls nor bears have control, leading to heightened volatility.
This pattern often appears after strong trends, where market participants struggle to establish a clear direction. The long shadows represent a battle between buyers and sellers, with prices oscillating widely before closing near the opening level.
What Does the High Wave Candlestick Pattern Indicate?
The high wave candlestick pattern suggests a state of indecision in the market. It highlights that both bullish and bearish forces are actively competing, but neither side is dominant. This pattern may indicate
- A possible reversal if it appears after a strong trend.
- Market consolidation before a breakout.
- Increased volatility, requiring confirmation from subsequent price movements.
Importance of High Wave Candlestick Pattern
The high wave candlestick pattern is valuable for traders as it provides insights into market sentiment. Its significance lies in
- Identifying uncertainty: Helps traders recognise potential turning points.
- Confirming trend exhaustion: When seen after a prolonged trend, it may signal a reversal.
- Assessing market volatility: The long shadows reveal heightened price swings, cautioning traders.
How to Interpret the High Wave Candlestick Pattern?
Interpreting the high wave pattern requires consideration of market conditions and additional indicators like
- Trend Context: If it appears in an uptrend, it may indicate bullish exhaustion; in a downtrend, it may suggest a reversal.
- Volume Analysis: Higher trading volume accompanying the pattern can strengthen its significance.
- Confirmation Candles: Traders should wait for the next few candles to confirm market direction before deciding.
How to Identify and Trade the High Wave Candlestick Pattern?
Identifying the High Wave Candlestick Pattern
- Look for a small-bodied candle with long wicks.
- Assess its position within the trend to determine potential outcomes.
- Confirm with technical indicators such as moving averages or RSI (Relative Strength Index).
Trading the High Wave Candlestick Pattern:
- Wait for Confirmation: Avoid entering trades solely based on a high wave candle; observe follow-up price action.
- Combine with Indicators: Use moving averages, Bollinger Bands, or RSI to strengthen your trade setup.
- Set Stop-Loss Orders: Placing stop-losses can mitigate risks due to its high volatility.
Conclusion
The high wave candlestick pattern is a powerful tool for traders looking to gauge market indecision and potential reversals. While it does not provide definitive buy or sell signals, when combined with technical indicators and confirmation strategies, it may enhance trading decisions. Traders should exercise caution, avoid impulsive trades, and always manage risk effectively.
Related Articles
FAQs on High Wave Candlestick Pattern
How can the High Wave Candlestick Pattern be used in combination with other indicators?
Traders often use the high wave pattern alongside moving averages, RSI, and Bollinger Bands to confirm trend reversals and market sentiment.
Does the high wave pattern also mean a reversal?
Not always. While it can indicate a potential reversal, confirmation from subsequent candles is necessary to determine the actual market direction.
What is the significance of the high wave candlestick pattern?
It highlights market indecision, helping traders identify possible trend exhaustion or periods of consolidation before a breakout.
Can the High Wave Candlestick Pattern be used in any market conditions?
Yes, it can appear in various market conditions, but its reliability increases when combined with additional technical indicators and trading volume analysis.
What timeframes are ideal for trading with the High Wave Candlestick Pattern?
It can be observed in multiple timeframes, but traders often use it in daily and hourly charts for better confirmation and analysis.
How reliable is the High Wave Candlestick Pattern for predicting market trends?
It is moderately reliable on its own. For better accuracy, traders should confirm signals with volume trends, support/resistance levels, and momentum indicators.
What does the High Wave Candlestick Pattern indicate in technical analysis?
It suggests market uncertainty, potential reversals, or periods of high volatility requiring confirmation before taking a trading decision.

