- Offerings
- Tools & Platforms
Tools & Calculators
- Open API
- Calculators
- SIP Calculator
- CAGR Calculator
- Compound Interest Calculator
- FD Calculator
- RD Calculator
- EPF Calculator
- Retirement Calculator
- HDFC SIP Calculator
- Mutual Fund Return Calculator
- Lumpsum Calculator
- Step Up SIP Calculator
- ETF SIP Calculator
- Brokerage Calculator
- Equity Margin Calculator
- SWP Calculator
- EMI Calculator
- MTF Calculator
- Pricing
- SKY Learn
- Mutual Funds
- Margin Trading
- Financial Planning
- Personal Finance
- Share Trading
- IPO
- Derivatives
- Currencies
- Intraday Trading
- Trading Strategies
- Demat Account
- Commodity
- ETF
IndiQube Spaces IPO
₹14,175/63 shares
Minimum Investment
IPO Details
23 Jul 25
25 Jul 25
₹14,175
63
₹225 to ₹237
NSE, BSE
₹700 Cr
30 Jul 25
IndiQube Spaces IPO Timeline
Bidding Start
23 Jul 25
Bidding Ends
25 Jul 25
Allotment Finalisation
28 Jul 25
Refund Initiation
29 Jul 25
Demat Transfer
29 Jul 25
Listing
30 Jul 25
IndiQube Spaces Limited
IndiQube Spaces Limited, founded in 2015, provides comprehensive workspace solutions for businesses. Catering to organisations of all sizes, IndiQube offers flexible options such as co-working spaces, private cabins, and virtual offices. Their services extend to workspace design, interior build-outs, technology integration, and operational support. Businesses can also access event spaces and premium business addresses without the need for physical offices.
Their clientele includes enterprises, unicorn start-ups, offshore development centres, and solopreneurs. Notable clients feature large enterprises like Myntra, Philips, KPMG, and Allegis; MNCs like Hitachi, Elanco, and Standard Chartered; and unicorns such as Unacademy, Fivetran, and RedBus. Start-ups like Scripbox, LendingKart, and Chargebee also rely on IndiQube’s innovative solutions. IndiQube’s offerings are tailored to modern businesses seeking functional, efficient, and flexible workspace environments.
IndiQube Spaces Limited IPO Overview
IndiQube Spaces is set to raise Rs. 850 crores through its upcoming IPO, as outlined in the draft red herring prospectus (DRHP) filed with SEBI. The IPO will consist of a fresh issue of equity shares worth up to Rs. 750 crores, along with an offer for sale (OFS) of equity shares totaling up to Rs. 100 crores. The OFS will be conducted by the promoter selling shareholders, Rishi Das and Meghna Agarwal. This move aims to strengthen IndiQube’s position in the market and provide funds for future growth and expansion.
IndiQube Spaces Limited Upcoming IPO Details
| Category | Details |
| Issue Type | Book Built Issue IPO |
| Total Issue Size | Fresh Issue: ₹750 crore
Offer for Sale (OFS): ₹100 crore |
| IPO Dates | TBA |
| Price Bands | TBA |
| Lot Size | TBA |
| Face Value | ₹1 per share |
| Listing Exchange | BSE, NSE |
| Shareholding pre-issue | TBA |
| Shareholding post -issue | TBA |
IndiQube Spaces IPO Lots
| Application | Lots | Shares | Amount |
| Retail (Min) | TBA | TBA | TBA |
| Retail (Max) | TBA | TBA | TBA |
| S-HNI (Min) | TBA | TBA | TBA |
| S-HNI (Max) | TBA | TBA | TBA |
| B-HNI (Min) | TBA | TBA | TBA |
IndiQube Spaces Limited IPO Reservation
| Investor Category | Shares Offered |
| QIB Shares Offered | Not more than 50% of the Offer |
| Retail Shares Offered | Not less than 35% of the Offer |
| NII (HNI) Shares Offered | Not less than 15% of the Offer |
IndiQube Spaces Limited IPO Valuation Overview
| KPI | Value |
| Earnings Per Share (EPS) | (26.09) |
| Price/Earnings (P/E) Ratio | TBD |
| Return on Net Worth (RoNW) | (261.43%) |
| Net Asset Value (NAV) | 10.03 |
| Return on Equity | – |
| Return on Capital Employed (ROCE) | 38.52% |
| EBITDA Margin | 27.25% |
| PAT Margin | (39.36%) |
| Debt to Equity Ratio | 1.26 |
Objectives of the IPO Proceeds
The Net Proceeds are intended to be utilised as per the details provided in the table below:
| Particulars | Amount (in ₹ million) |
| Funding capital expenditure towards establishment of new centres | 4,626.49 |
| Repayment and / or prepayment, in part or in full, of certain outstanding loans | 1,000 |
| General corporate purposes* | [●] |
Note: *To be determined upon finalisation of the Offer Price and updated in the Prospectus prior to filing with the RoC
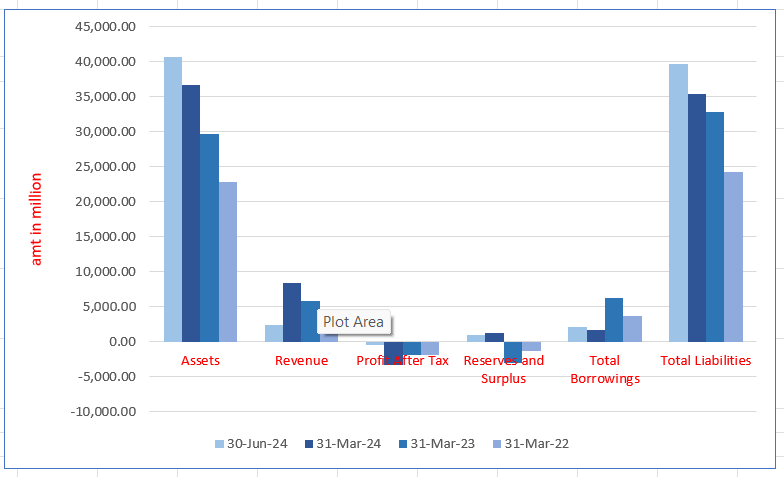
IndiQube Spaces Limited Financials (in million)
| Particulars | 30 June 2024 | 31 Mar 2024 | 31 Mar 2023 | 31 Mar 2022 |
| Assets | 40,657.42 | 36,679.13 | 29,693.17 | 22,837.93 |
| Revenue | 2422.65 | 8305.73 | 5797.38 | 3441.11 |
| Profit After Tax | (420.40) | (3415.08) | (1981.09) | (1883.79) |
| Reserves and Surplus | 889.16 | 1294.40 | (3082.84) | (1386.99) |
| Total Borrowings | 2062.53 | 1640.20 | 6231.61 | 3632.15 |
| Total Liabilities | 39,756.33 | 35,372.80 | 32,774.18 | 24,223.28 |
Financial Status of IndiQube Spaces Limited
SWOT Analysis of IndiQube Spaces IPO
Strength and Opportunities
- Diverse client base, including enterprises, unicorns, and startups, showcasing flexibility in catering to different business needs and adapting to market trends effectively.
- Extensive portfolio of 103 centres across 13 cities with 7.76 million sq ft, demonstrating strong presence and ability to scale operations across major markets in India.
- Backed by investors like WestBridge Capital and Ashish Gupta, offering financial stability, growth potential, and strategic support to expand operations and reach new business milestones.
- Offers comprehensive services including workspace design, technology integration, and operational support, which enhances client satisfaction, creating value beyond traditional office leasing solutions.
- Launched MiQube app for better client engagement and operational management, demonstrating innovation and focus on technology to enhance user experience and streamline workspace services.
- Plans to establish new centers using IPO proceeds, reflecting the company’s growth ambitions and ability to attract funding for future expansion across the nation.
- Flexible workspace solutions cater to clients ranging from solopreneurs to large enterprises, offering scalable options that suit businesses of various sizes and operational needs.
- Experience in managing large seating capacities, with 172,451 seats, showcasing scalability and ability to handle large client bases effectively in varied environments.
- Commitment to sustainability and energy efficiency aligns with global environmental trends, positioning IndiQube as an eco-conscious brand and enhancing appeal to sustainability-focused businesses.
- Strong leadership with experienced founders guiding strategic direction and operational growth, ensuring that IndiQube remains adaptable and capable of navigating market shifts.
- Growing demand for flexible workspaces due to the rise of hybrid work models, presenting significant market expansion opportunities and the chance to tap into new sectors.
Risks and Threats
- Net loss of ₹341.5 crore in FY24, increasing from ₹198 crore in FY23, reflecting financial challenges in sustaining profitability and operational efficiency in a competitive market.
- Declining EBITDA margin to 27.25% in FY24 from previous years, highlighting inefficiencies in cost management and affecting the company’s profitability and operational performance.
- Increased competition from established players like Awfis and 91springboard, which presents a challenge in retaining market share and offering competitive pricing for clients.
- Heavy reliance on Bengaluru market with 60 centres; dependency on a single city exposes the company to regional market risks and limits geographic diversification.
- Rising operating expenses leading to growing losses, requiring strategic cost-cutting measures and improved financial discipline to manage operational expenditures effectively.
- Borrowings of ₹227.45 crore as of FY24, increasing interest obligations and financial strain, highlighting a need to manage debt more efficiently to ensure long-term sustainability.
- Service quality maintenance challenges across diverse locations, risking potential client dissatisfaction if consistency in experience is not upheld across all IndiQube centres.
- Market saturation in key cities, particularly Bengaluru, limits opportunities for growth, posing challenges to capture new clients and grow beyond mature markets.
- Economic downturns and shifting client needs could reduce demand for leased office spaces, directly impacting revenue generation and long-term business growth potential.
- Regulatory changes in the real estate and workspace management sectors may pose compliance challenges, requiring timely adaptation to avoid legal risks and financial penalties.
- Industry trends evolve rapidly, requiring continuous adaptation in business models, services, and technology to stay competitive and meet changing client demands effectively.
Explore IPO Opportunities
Explore our comprehensive IPO pages to stay updated on the latest trends and insights.
About IndiQube Spaces Limited
IndiQube Spaces Limited is a managed workplace solutions provider, offering sustainable, technology-driven solutions to transform the traditional office environment. With a rich history dating back to 1999, the company’s leadership brings entrepreneurial expertise to provide diverse and scalable workplace solutions, from expansive corporate hubs to smaller branch offices.
Comprehensive Workspace Solutions
IndiQube’s services range from providing large corporate offices to customized small-scale branch offices, transforming the workspace experience. The integration of interiors, technology, and value-added services (VAS) enhances the productivity and well-being of employees.
- Backward Integration: Focuses on asset renovation and build-to-suit models.
- Forward Integration: Delivers business-to-business and business-to-consumer services, further elevating workspace experiences.
Expanding Presence Across India
As of June 30, 2024, IndiQube manages 103 centres across 13 cities, covering 7.76 million square feet of space. With a seating capacity of 172,451, the company has expanded by 3.73 million square feet through 41 new properties in five cities.
- Bengaluru: Dominates the flexible workspace market, with 60 centres spread across 5.04 million square feet, making up the largest portion of their portfolio.
- Market Strategy: IndiQube prioritizes high-demand locations and partners with landlords to transform non-institutional properties into green, modern workspaces.
Client-Centric Approach
IndiQube’s client base spans over 737 clients, including global capability centres and Indian enterprises. The company’s ‘enterprise-first’ demand strategy caters to businesses needing scalable, long-term workspaces, with 59.31% of the portfolio dedicated to clients requiring over 300 seats.
Financial Strength and Stability
With robust financial metrics, including an occupancy rate of 91% and an annualized return on capital employed of 32.09%, IndiQube showcases its operational efficiency and stability. Their strong credit rating of CRISIL A+/Stable as of September 30, 2024, underscores the company’s financial health.
Diverse Service Offerings
IndiQube’s portfolio includes:
- IndiQube Grow: Plug-and-play office spaces.
- IndiQube Bespoke: Customizable design and build solutions.
- IndiQube One: B2B and B2C services, including facility management.
- MiQube: Technology-driven smart workspace solutions.
- IndiQube Cornerstone: Renovating and upgrading aging properties.
Strategic Market Expansion
IndiQube’s footprint spans major cities like Bengaluru, Chennai, and Pune, along with a presence in non-Tier I cities such as Coimbatore and Kochi. This geographical diversification helps the company meet the demand for flexible workspaces across diverse business sectors.
Demand Acquisition Strategy:
- Combines in-house sales team, market research, partnerships, and digital initiatives.
- Direct channels: 44.23% of seats sold (client referrals, website leads, expansions, and digital campaigns).
- Broker-assisted sales: 55.77% of seats.
- Occupancy rate: 91.00% as of June 30, 2024.
Enterprise-Focused Approach:
- Focus on clients needing more than 300 seats.
- 59.31% of occupancy from clients with over 300 seats.
- Long-term contracts: 50-month average lease tenure, 37-month lock-in period.
Supply Acquisition Strategy:
- Target properties in high-demand micro-markets, focusing on hub-and-spoke model.
- Lease renewal rate: 100% with landlords as of June 30, 2024.
- 83.92% of portfolio in key Tier I markets.
- Focus on property upgradation, including renovating Grade B properties.
Non-Tier I Cities Expansion:
- Presence in 6 non-Tier I cities.
- 28.16% of centres renovated to tech-enabled spaces.
- Strong demand in cities like Coimbatore, Kochi, and Jaipur.
Key Metrics (As of June 30, 2024):
- 7.76 million square feet in AUM across 13 cities.
- Occupancy rate: 91.00% in steady-state centres.
- 91.00% occupancy in steady-state centres, with low churn
Industry Outlook
Overview of the Indian Office Market
- Current Market Size: India’s organized commercial office stock stands at 853 Mn sq. ft. as of June 2024, concentrated in top 9 cities (Bengaluru, MMR, Hyderabad, Gurgaon, Chennai, Pune, Noida, Kolkata, and Delhi).
- Market Evolution: Office stock grew from 46 Mn sq. ft. in 2003 to 853 Mn sq. ft. in 2024, with an expected 6.6% CAGR, reaching 1,075 Mn sq. ft. by 2027.
- Demand Drivers: Key drivers include economic growth, IT industry, flexible workspaces, and demand from domestic and international companies.
- Recent Trends: Post-pandemic recovery, with strong leasing activity and a projected strong supply influx in 2024, especially in Bengaluru, Hyderabad, and Delhi NCR.
Grade Classification of Office Stock (As of June 30, 2024)
As of June 30, 2024, 85% (728 Mn sq. ft.) of India’s commercial office stock is Grade A, while 15% (125 Mn sq. ft.) is Grade B. Grade A office stock grew at a CAGR of 15%, while Grade B grew at 6%. The demand for Grade A assets continues to rise, decreasing the share of Grade B stock.
Key Drivers of Office Demand
- Large, English-Speaking Talent Pool: India is the second-largest English-speaking country globally, with over 350 million English speakers and a significant supply of STEM graduates. It accounts for 28% of the global STEM workforce, positioning India as a major tech talent hub.
- Competitive Cost Advantage: India offers skilled talent at a lower cost compared to other global cities, making it an attractive offshoring destination for enterprises.
- Growth of Global Capability Centres (GCCs): The rise of GCCs in India, supported by skilled talent, affordable infrastructure, and favourable government reforms, is a key driver of office demand.
Recent Trends in the Indian Office Market
- Return-to-Office Pace: 90% of occupiers prefer 3+ days in-office per week.
- Growing Occupancy: Expected to reach 75-80% in CY2024.
- Employee Experience Focus: Increasing demand for ‘experiential workplaces’ that enhance productivity.
- Design & Well-being Integration: Emphasis on quality, safety, and wellness-oriented properties.
- Sectors Driving Demand: Technology, BFSI, flexible workspaces, and life sciences leading office leasing.
- Sustainability: Occupiers increasingly prioritizing sustainable buildings for workspace leasing.
Emergence of Flexible Workspaces in the Office Sector
- Growth in Flexible Workspace Stock: From 35 million sq. ft. in 2020 to 72 million sq. ft. in 2024 in Tier 1 cities.
- Increase in Companies Adopting Flex Spaces: 42% of companies had flexible office space in Q1 2024; expected to rise to 59% by 2026.
- Key Growth Drivers: Hybrid work models, capital efficiency, shift in work culture, and demand from both startups and large enterprises.
- Benefits: Reduced upfront investment, flexibility in space usage, operational outsourcing, and bespoke workspace solutions.
Growing Demand for Flexible Workspaces in India
- Demand for flexible workspaces in India is balanced between domestic and international companies, contributing over 70% of new transactions.
- Technology companies lead demand, followed by BFSI and E&M sectors.
- The post-pandemic focus on portfolio agility has increased flexible workspace demand, with 30% of occupiers planning to expand usage within 12 months.
- Domestic occupiers prefer flexible spaces more than American corporates.
Top Markets for Flexible Workspaces in India:
- Bengaluru: The largest market, accounting for over 30% of flexible workspace stock in Tier 1 cities.
- Pune, Noida & Chennai: Gaining traction alongside traditional hubs like Bengaluru, Gurgaon, Mumbai, and Hyderabad
Outlook for Flexible Workspace Sector in India
- Growth in Demand: Flexible workspace stock increased by 12-14 Mn sq. ft. in 2023.
- Key Drivers: Flexibility, cost optimization, employee well-being, and operational outsourcing.
- Future Projections: Flexible workspace stock in Tier 1 cities to grow from 62-64 Mn sq. ft. in 2023 to 124-126 Mn sq. ft. by 2027.
- Market Opportunity: Total addressable market (TAM) estimated at 325-330 Mn sq. ft. and ₹787-1,035 Bn by 2027.
Growth Trends in Managed Office Spaces
- Hybrid Work Model: Rising demand due to flexible work arrangements.
- Employee Experience: Focus on wellness amenities boosts growth.
- Technological Integration: Smart offices enhance productivity.
- Flexible Leasing: Short-term leases attract scalable businesses.
- Increased Amenities: On-site services drive demand.
- Ancillary Revenue: Additional services increase profitability.
- Tier-2 Cities Expansion: Growth in smaller cities due to lower costs.
How Will IndiQube Spaces Limited Benefit?
- Rising Demand for Flexible Workspaces
As flexible workspace demand grows, IndiQube can tap into the expanding market, especially with increased adoption of hybrid work models by both startups and established enterprises.
- Technological Integration
By incorporating smart office solutions, IndiQube Spaces can enhance productivity, making their spaces more attractive to tech-driven companies and modern businesses.
- Focus on Employee Well-being
- With a growing emphasis on wellness-oriented workplaces, IndiQube can differentiate its offerings by incorporating employee experience-focused amenities, appealing to companies prioritising worker satisfaction.
- Tier-2 Cities Expansion
Expanding to smaller cities allows IndiQube Spaces to benefit from lower operational costs, while tapping into new markets with rising demand for flexible workspaces.
- Short-term Leasing
Offering flexible, short-term leases can attract businesses seeking scalable solutions, particularly post-pandemic, supporting a steady stream of demand from growing enterprises.
- Cost Optimization
With flexible workspace solutions, IndiQube Spaces can offer cost-effective options for businesses looking to reduce overheads while maintaining high-quality office environments.
- Hybrid Work Model Support
As more companies adopt hybrid work models, IndiQube can provide versatile spaces that support both in-office and remote working, increasing its appeal across industries.
- Operational Outsourcing
By managing operations and offering fully serviced office spaces, IndiQube can attract companies looking to outsource non-core tasks, further enhancing its value proposition.
- Scalability for Enterprises
IndiQube can cater to businesses that require scalable workspaces, allowing them to easily adjust office space as their teams grow or contract, ensuring long-term customer retention.
- Increased Investment Opportunities
The growth in flexible workspaces opens doors for increased investment in real estate and infrastructure, positioning IndiQube Spaces to capitalize on rising demand and industry expansion.
Peer Group Comparison
| Name of the Company | Face Value (₹ per share) | Total Income
(in ₹ Million) |
EPS | NAV
(₹ per share) |
P/E | RoNW
(%) |
| IndiQube Spaces Limited | 1.00 | 8,676.60 | (26.09) | 10.03 | NA | (261.43) |
| Awfis Space Solutions Limited | 10 | 8,748.03 | (2.79) | 127.74 | NA | (6.99) |
Key Insights
- Face Value: IndiQube Spaces Limited has a face value of ₹1 per share, whereas Awfis Space Solutions Limited has a face value of ₹10 per share. A lower face value in IndiQube could indicate a more accessible share price, potentially appealing to smaller investors.
- Total Income: Both companies show comparable total income figures, with IndiQube earning ₹8,676.60 million and Awfis earning ₹8,748.03 million. This indicates that both companies have a similar revenue scale, suggesting parity in their market presence.
- EPS: IndiQube’s EPS is negative at (26.09) for both basic and diluted, while Awfis reports a similarly negative (2.79). Negative EPS indicates both companies are currently unprofitable, with IndiQube showing a more substantial loss per share.
- NAV: IndiQube’s NAV is ₹10.03, significantly lower than Awfis’s ₹127.74. A lower NAV suggests that IndiQube may not have as strong equity backing or assets per share, pointing to potentially higher risk compared to Awfis.
- P/E: Both companies have an NA (Not Available) P/E ratio, implying that neither company is currently generating earnings to measure against their share prices. This reflects the ongoing unprofitability and the difficulty of valuing these companies through traditional profitability metrics.
- RoNW: IndiQube’s RoNW is extremely negative at (261.43%), while Awfis’s RoNW is also negative at (6.99%). Both companies have negative returns on net worth, indicating that neither has been able to generate returns on shareholders’ equity, which is a key concern for investors.
IndiQube Spaces Limited IPO Strengths
- Strong Market Position and Expanding Services
The company is a leader in India’s flexible workspace market, covering 79 million square feet across 13 cities, with strong presence in high-demand Tier-I cities like Bengaluru. It also focuses on expanding value-added services (VAS) like interior design, facility management, and F&B, driving a 61.88% CAGR in VAS revenue and diversifying its revenue streams.
- Strong Acquisition Strategy for Value Creation
Focusing on key micro-markets, the company has invested in properties in prime locations near metro stations, ensuring long-term market relevance. The company’s strategy of acquiring properties in strategic locations and its ability to renovate older buildings into tech-enabled workspaces demonstrates its commitment to value creation and enhancing operational efficiency across its portfolio.
- Prudent Business Management and Financial Stability
As of June 30, 2024, 67.82% of IndiQube’s portfolio consists of full buildings, focusing on cost-efficient hubs. Their lease structures align client and landlord lock-ins, enhancing operational stability and minimizing early lease terminations. The company maintains a strong market position with low churn rates, reflecting effective business practices. Their cash EBIT margin reached 9.80%, demonstrating their ability to deliver value while maintaining profitability.
- Capital Efficient Model with Resilience and Comprehensive Risk Mitigation
The company has implemented an asset-light strategy, focusing on leasing properties with 10-year agreements, including a 3-year lock-in period. This provides flexibility and control, with termination rights for adaptability in changing markets. The capital expenditure for fit-outs is ₹1,507 per square foot as of June 2024, reflecting operational efficiency and cost optimization. Additionally, the company maintains a diversified client base, with its top client contributing only 3.67% of revenue.
- Experienced Leadership and Investor Confidence
The company is led by experienced Promoters, Rishi Das, Meghna Agarwal, and Anshuman Das, with a proven track record in the workspace industry. Their leadership has earned the company recognition as one of India’s fastest-growing businesses. Backed by prominent investors like WestBridge Capital and Ashish Gupta, the company benefits from both financial support and strategic guidance for continued growth.
- Focused on Sustainable Green Buildings
The company prioritizes sustainability through initiatives like rooftop solar plants, water treatment systems, and energy-saving equipment. As of June 30, 2024, 25.29% of operational areas across 15 centres have green certifications. Additionally, 10 out of 29 renovated centres are green-certified or in the process of certification. These efforts, including energy efficiency and waste management, align with the growing demand for green buildings and ESG compliance.
Key Insights from Financial Performance
- Assets: The company’s total assets have shown significant growth, rising to ₹40,657.42 million as of June 30, 2024, compared to ₹36,679.13 million in March 2024, ₹29,693.17 million in March 2023, and ₹22,837.93 million in March 2022. This steady increase reflects strong asset accumulation and business expansion.
- Revenue: Revenue for the period ending June 30, 2024, is ₹2,422.65 million, showing a substantial decline from ₹8,305.73 million in March 2024. Despite the decrease, the revenue is up from ₹5,797.38 million in March 2023 and ₹3,441.11 million in March 2022, indicating fluctuations but overall growth.
- Profit After Tax (PAT): The company reported a negative Profit After Tax (PAT) of ₹(420.40) million in June 2024, improving from ₹(3,415.08) million in March 2024. However, losses are still higher compared to ₹(1,981.09) million in March 2023 and ₹(1,883.79) million in March 2022, showing consistent challenges in profitability.
- Reserves and Surplus: The reserves and surplus stood at ₹889.16 million in June 2024, a drop from ₹1,294.40 million in March 2024. The reserves were negative in March 2023 at ₹(3,082.84) million and ₹(1,386.99) million in March 2022, reflecting improvements in financial health and asset management.
- Total Borrowings: Borrowings increased to ₹2,062.53 million in June 2024 from ₹1,640.20 million in March 2024. Borrowings were significantly higher at ₹6,231.61 million in March 2023 and ₹3,632.15 million in March 2022, indicating a shift towards better debt management and a reduction in reliance on external borrowings.
- Total Liabilities: The company’s total liabilities grew to ₹39,756.33 million in June 2024, up from ₹35,372.80 million in March 2024. Liabilities were ₹32,774.18 million in March 2023 and ₹24,223.28 million in March 2022, reflecting the growing financial obligations tied to asset and operational growth.
Other Financial Details
- Purchases of Traded Goods: Purchases of traded goods have decreased significantly in the three months ending June 2024 (110.98) compared to previous years, indicating a reduction in inventory or trade activity. This could be attributed to supply chain optimization or reduced sales during the period.
- Employee Benefits Expense: This expense has increased notably in the year ended March 2024 (637.68), reflecting growth in headcount, compensation structure, or both. It was lower in previousyears, but still indicates a strong investment in workforce expansion and retention to support operations.
- Finance Costs: Finance costs saw a significant rise over the years, with the largest amount recorded in the year ending March 2024 (2,560.02). This could indicate increased borrowing or higher interest rates, impacting overall cost structure and financial management.
- Depreciation and Amortisation Expense: These expenses increased sharply in the year ending March 2024 (3,922.43), suggesting significant capital expenditure on long-term assets such as property, plant, or equipment. This is typically seen when a company upgrades or expands its asset base.
- Other Expenses: Other expenses surged to 5,014.93 for the year ending March 2024, driven by rising operational costs, overheads, or unforeseen expenditures. This increase highlights the expanding scope of business activities or challenges in managing operational cost efficiency.
Key Strategies for IndiQube Spaces Limited
- Expand Area Under Management by Balancing Market Presence and Micro Market Penetration
IndiQube Spaces Limited continues to expand its Area Under Management (AUM), reaching 7.76 million square feet as of June 30, 2024. The strategy includes broadening its market presence in new cities and deepening its footprint in existing ones by acquiring smaller properties (spokes) first, followed by larger properties (hubs). This approach mitigates risks while capitalizing on growth opportunities.
- Enhance Average Revenue Per Square Foot Through an Integrated Workspace Solutions Ecosystem
IndiQube’s integrated ecosystem, which includes IndiQube Grow, Bespoke, One, and MiQube, aims to meet diverse client needs across industries. By providing customized workspaces, design solutions, facility management, and technology services, IndiQube enhances average revenue per square foot. The company plans to strengthen this ecosystem by adding sustainable offerings like green energy solutions, ensuring long-term revenue growth.
- Become a Preferred Workspace Outsourcing Solutions Partner for Enterprises
IndiQube Spaces Limited is focused on evolving into a preferred outsourcing partner for enterprises by offering integrated workspace solutions. The company plans to support businesses in setting up corporate hubs, branch offices, and offering value-added services like renovation, automation, and operational excellence. This strategy aims to redefine the workspace journey by providing personalized, on-demand, and smart solutions.
- Scale IndiQube Bespoke and Offer Comprehensive Office Interiors Solutions
IndiQube plans to scale its IndiQube Bespoke service, offering comprehensive office interior solutions beyond its current workspace ecosystem. With a catalogue of over 1,000 office interior SKUs and the IndiQube Canvas experience centre, clients can create customized office spaces aligned with their brand identity. The goal is to integrate innovative solutions to maintain cost efficiency and foster business growth.
- Expand ‘Sustainability as a Service’ Offerings
IndiQube focuses on transforming aging properties into sustainable spaces by collaborating with landlords to upgrade and renovate buildings. The company is also constructing a solar farm in Karnataka to meet captive energy needs. Through its “Sustainability as a Service” model, IndiQube helps businesses transition to green-certified buildings, offering services like energy efficiency, water conservation, and waste management.
- Leverage Technology to Expand Our Client Base
IndiQube uses technology to enhance the client experience, offering a unified platform through MiQube for managing office spaces. The company plans to expand its technology suite to provide SaaS products to landlords and property managers, streamlining property management and unlocking new revenue opportunities. This strategy enhances operational efficiency and elevates the employee experience across the workspace ecosystem.
How to apply IPO with HDFC SKY?
Follow these simple steps to apply for an IPO through HDFC SKY. Secure your investments and explore new opportunities with ease by accessing the IPOs available on the platform.
1Login to your HDFC SKY Account
2Select Issue
3Enter Number of Lots and your Price.
4Enter UPI ID
5Complete Transaction on Your UPI App
FAQs On IndiQube Spaces IPO
What is IndiQube Spaces Limited's IPO?
IndiQube Spaces Limited, a workplace solutions provider, plans to raise ₹850 crore through an initial public offering (IPO). The IPO includes a fresh issue of equity shares worth ₹750 crore and an offer for sale of ₹100 crore.
When did IndiQube Spaces file for the IPO?
IndiQube Spaces filed its draft red herring prospectus (DRHP) with the Securities and Exchange Board of India (SEBI) on December 24, 2024.
What is the purpose of the IPO proceeds?
The company intends to utilize the net proceeds from the fresh issue for capital expenditures to establish new centres, repay borrowings, and for general corporate purposes.
Who are the lead managers for the IPO?
ICICI Securities Ltd and JM Financial Ltd are the book-running lead managers for IndiQube Spaces’ IPO.
On which stock exchanges will the shares be listed?
The equity shares of IndiQube Spaces are proposed to be listed on the Bombay Stock Exchange (BSE) and the National Stock Exchange (NSE).
What is the expected timeline for the IPO?
The IPO is expected to open in the last week of March 2025, with the listing anticipated shortly thereafter.
What is the face value of the equity shares?
The face value of each equity share is ₹1.
How can investors apply for the IPO?
Investors can apply for the IPO through the ASBA (Application Supported by Blocked Amount) process via their banks or through online trading platforms once the issue opens.

