- Offerings
- Tools & Platforms
Tools & Calculators
- Open API
- Calculators
- SIP Calculator
- CAGR Calculator
- Compound Interest Calculator
- FD Calculator
- RD Calculator
- EPF Calculator
- Retirement Calculator
- HDFC SIP Calculator
- Mutual Fund Return Calculator
- Lumpsum Calculator
- Step Up SIP Calculator
- ETF SIP Calculator
- Brokerage Calculator
- Equity Margin Calculator
- SWP Calculator
- EMI Calculator
- MTF Calculator
- Pricing
- SKY Learn
- Mutual Funds
- Margin Trading
- Financial Planning
- Personal Finance
- Share Trading
- IPO
- Derivatives
- Currencies
- Intraday Trading
- Trading Strategies
- Demat Account
- Commodity
- ETF
- What is the Meaning of Long Legged Doji Candlestick Pattern?
- Characterises of Long Legged Doji
- How Does the Long Legged Doji Candlestick Pattern Work?
- How to Identify and Trade a Long Legged Doji?
- Long Legged Doji Example
- Advantages and Disadvantages of Long Legged Doji Candlestick Pattern
- Other Types of Doji Patterns
- Conclusion
- FAQs
What is Long Legged Doji? How to Identify and Trade a Long Legged Doji?
By HDFC SKY | Updated at: Jul 24, 2025 06:18 PM IST
- Definition: A Long-Legged Doji features long upper and lower shadows with a near-identical open and close price, signaling strong market indecision.
- Market Sentiment: Represents a tug-of-war between buyers and sellers; neither side gains clear control.
- Occurrence: Can appear in both uptrends and downtrends, often indicating potential reversal or pause in trend momentum.
- Bullish Signal: When found in a downtrend, it may suggest a bullish reversal as sellers lose strength.
- Bearish Signal: When seen in an uptrend, it may signal a bearish reversal as buying momentum fades.
- Confirmation Needed: Traders are advised to wait for the next candle to confirm the directional bias before making decisions.
- Risk Management: Emphasizes stop-loss placement below/above the Doji’s shadows to manage risk.
- Use in Strategy: Often used alongside technical indicators (like RSI, MACD) for higher probability setups.
A long-legged Doji is one where the opening and closing prices of the candlestick are almost the same and there are both long upper and lower shadows. The long legged doji candlestick pattern plays a crucial role in market analysis. It indicates indecision among traders, with both buyers and sellers struggling to gain control. Understanding its formation and significance can help traders make more informed decisions about potential trend reversals or consolidations in the market.
What is the Meaning of Long Legged Doji Candlestick Pattern?
The long legged doji candlestick indicates market uncertainty, where the upper and lower shadows are long while the body remains small. This pattern highlights that neither buyers nor sellers dominate, suggesting uncertainty.
A red long legged doji candlestick refers to a bar with a bearish real body, while a green long legged doji candlestick highlights a bullish market sentiment.
The long legged doji candle suggests that a trend could be nearing a reversal or a period of consolidation after a substantial price movement. This pattern often signals that the current trend might lose momentum, and the market could pause or change direction.
A long legged doji candlestick is especially useful for spotting moments of market instability where neither buyers nor sellers gain control. When you spot a long leg doji, it can indicate a potential shift in market dynamics, giving traders a valuable signal to watch for a change in price action.
Characterises of Long Legged Doji
A long legged doji candlestick has four key characteristics:
- Extended Shadows: The long legged doji pattern is recognised by its long shadows above and below the candlestick’s body. These extended wicks indicate significant price movement during the trading period, highlighting market volatility.
- Small Body: The body of the long legged doji is typically small, meaning the opening and closing prices are almost the same. This suggests market indecision, where neither buyers nor sellers have a clear advantage.
- Candlestick Colour: The colour of the long legged doji candlestick (whether filled or hollow) is not as important as the size and position of the body. The focus is on the small body and the long shadows, which reflect the uncertainty in the stock market.
- Context in the Market: The long legged doji is most significant when the prevailing market trend is analysed. It often appears after a strong price movement, whether up or down, and may signal a potential reversal or a pause in the current trend.
How Does the Long Legged Doji Candlestick Pattern Work?
The long legged doji candlestick pattern is a key indicator of market indecision. It forms when the upper and lower shadows are long, and the body remains small, showing that buyers and sellers struggle for control. The long legged doji candlestick signals potential trend reversal or consolidation, indicating that the market may be pausing or preparing for a shift.
The long legged doji pattern is particularly important after a firm price movement because it signals uncertainty in the market. The current trend may be losing strength, as neither buyers nor sellers have gained a clear advantage. This can lead to a potential price pause or even a reversal.
Traders often use the long legged doji candle to identify moments of indecision, helping them to decide whether to wait for further confirmation before taking action. The long legged doji candlestick pattern is crucial for understanding potential shifts in the market’s direction.
How to Identify and Trade a Long Legged Doji?
To identify a long legged doji, look for these key features:
- Small body: The opening and closing prices are nearly the same, forming a tiny body that can appear in red or green.
- Long upper and lower shadows: The shadows are significantly extended, sometimes equal in length, indicating substantial price movement within the period.
- Minimal body size: The body remains small compared to the shadows, displaying the limited price difference between the open and close.
When trading this pattern, one can follow these steps:
- Observe the Market First: This pattern shows uncertainty, so avoid making quick decisions. Watch how the price moves after the doji forms. If it goes above the high, it may indicate a buying opportunity, while a drop below the low could suggest a selling chance.
- Use Moving Averages for Confirmation: If a long legged doji candlestick appears near a moving average, it could signal a possible breakout or reversal. Wait for the next trading session to confirm the trend before entering a trade.
- Combine with Other Indicators: Do not rely on this pattern alone. To improve accuracy, support your analysis with indicators such as volume or momentum oscillators. Using multiple signals can help you make better trading decisions.
- Manage Risk Carefully: Protect your investment by setting stop-loss orders to limit potential losses. A clear trading plan prevents impulsive decisions and helps maintain a disciplined approach.
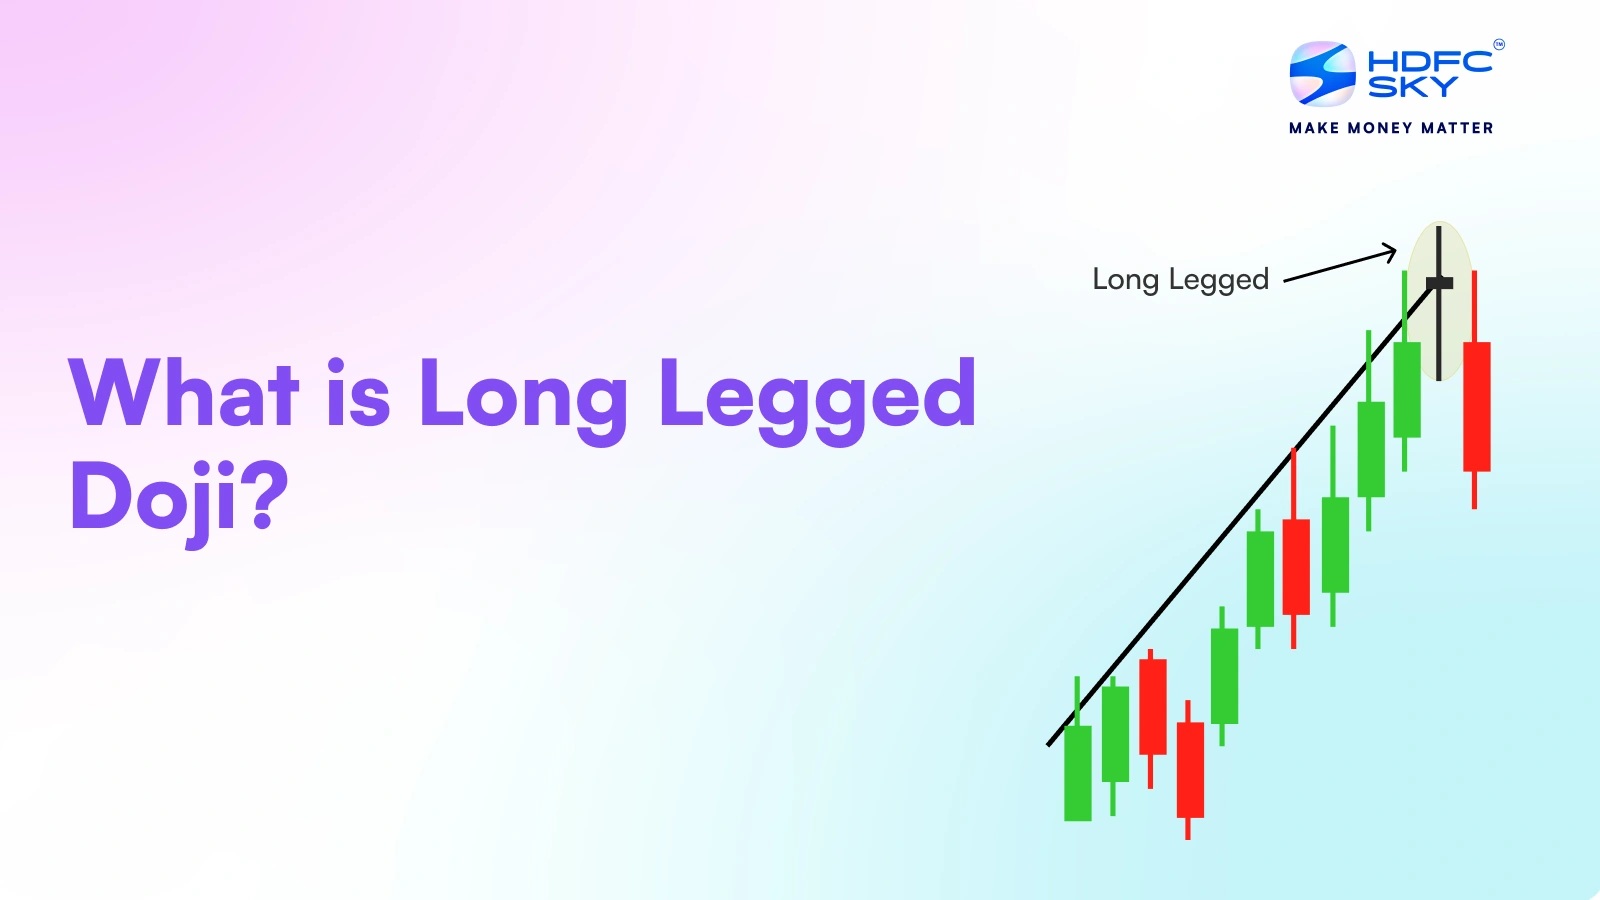
Long Legged Doji Example
In a long legged doji example, imagine a price decline followed by the formation of a long legged doji candle. This candlestick has long upper and lower shadows, signalling significant price movement yet minimal change between the opening and closing prices. It reflects indecision between buyers and sellers.
After the long legged doji pattern forms, the price moves sideways for a while. before attempting an upward shift. However, the upward movement doesn’t gain momentum, and the price eventually starts to fall again, showing that the market is still uncertain.
As the price drops, another long leg doji appears, indicating further indecision. Following this long legged doij candle, the price breaks out of the consolidation and rises. Although the long legged doji pattern didn’t directly cause the reversal, it highlighted hesitation in the market and pointed to a potential directional shift.
This long legged doji example effectively demonstrates how this candlestick pattern signals indecision and possible trend changes.
Advantages and Disadvantages of Long Legged Doji Candlestick Pattern
The advantages and disadvantages of long legged doji candlestick pattern are as follows:
Advantages of Long Legged Doji Candlestick Pattern:
- Flexible Across Timeframes: The long legged doji can be applied to various timeframes, allowing traders to use it for short-term and long-term strategies.
- Straightforward Entry/Exit Guidance: Traders can use the long legged doji to identify potential entry and exit points, helping to improve trade execution.
- Signals Trend Reversals: A long legged doji can be a valuable tool in identifying potential reversals in market direction, offering early warning signs.
- Validates Other Analysis Tools: It can act as an additional confirmation signal alongside other technical analysis methods.
- Insight into Market Mood: The pattern clearly indicates market indecision, helping traders understand market sentiment.
Disadvantages of Long Legged Doji Candlestick Pattern:
- Risk of False Signals: The pattern can sometimes send false signals that have to be confirmed by other indicators.
- Needs Experienced Traders: The pattern interpretation requires good technical analysis experience.
- Unpredictable in Sideways Markets: In consolidating markets, the long legged doji can be less effective and lead to misinterpretation.
- May Not Apply to All Markets: The pattern may not be reliable in all market conditions, especially in certain asset classes.
- Confusing for Beginners: New traders may struggle to read this pattern effectively without further education or experience.
Other Types of Doji Patterns
Some of the other types of doji patterns include:
- Dragonfly Doji: A bullish pattern suggesting a potential reversal in an uptrend, with a long lower wick, a small upper wick, and the body near the top.
- Gravestone Doji: A bearish pattern indicating market rejection of higher prices, featuring a long upper wick and little or no lower wick.
- Doji Star: A three candle pattern highlighting the market’s indecision and signalling a possible trend reversal.
- Standard Doji: A basic pattern showing indecision with long wicks on both sides of a small body.
- 4-Price Doji: A rare pattern where the open, close, high, and low are identical, reflecting extreme market instability.
Conclusion
The long legged doji is a valuable candlestick pattern for identifying market indecision and potential trend reversals. By understanding its formation and meaning, traders can better anticipate shifts in market direction. However, relying solely on this pattern without confirmation from other indicators may lead to false signals.
Related Articles
FAQs
Is a long legged doji bullish or bearish?
A long legged doji candlestick is neither inherently bullish nor bearish. It signals market indecision, where neither buyers nor sellers dominate. However, if it appears after a strong trend, the long legged doji bullish or bearish sentiment depends on the context and requires confirmation from other indicators before making trading decisions.
How to use long legged doji?
To effectively use the long legged doji candlestick pattern, look for its formation after a strong trend. The long legged doji candle means the indecision of the market. Confirming the pattern with additional indicators before making any decisions is important. It may indicate a potential reversal, especially near key support or resistance levels.
When is the right time to trade using long legged doji candlesticks?
The right time to trade using the long legged doji candlestick is when it appears after a firm price movement, especially near key support or resistance levels.
How accurate is the long legged doji candlestick in technical analysis?
The long legged doji pattern has a moderate level of accuracy in technical analysis. While it may indicate market indecision and potential trend reversal, its reliability depends on the context.
What is the significance of a long legged doji?
The long legged doji is significant because it reflects market indecision. This long doji candlestick shows equal pressure from buyers and sellers, leading to a close near the opening price. It typically appears at key levels, such as suppo_rt or resistance, suggesting a possible trend reversal or consolidation.
What is the difference between a long legged doji and a gravestone doji?
The long legged doji candle has long shadows on both sides, indicating the market’s indecision. In contrast, the gravestone doji has a long upper shadow and a small or absent lower shadow, often signalling a bearish reversal.

