- Offerings
- Tools & Platforms
Tools & Calculators
- Open API
- Calculators
- SIP Calculator
- CAGR Calculator
- Compound Interest Calculator
- FD Calculator
- RD Calculator
- EPF Calculator
- Retirement Calculator
- HDFC SIP Calculator
- Mutual Fund Return Calculator
- Lumpsum Calculator
- Step Up SIP Calculator
- ETF SIP Calculator
- Brokerage Calculator
- Equity Margin Calculator
- SWP Calculator
- EMI Calculator
- MTF Calculator
- Pricing
- SKY Learn
- Mutual Funds
- Margin Trading
- Financial Planning
- Personal Finance
- Share Trading
- IPO
- Derivatives
- Currencies
- Intraday Trading
- Trading Strategies
- Demat Account
- Commodity
- ETF
Long Lower Shadow Candlestick Pattern
By HDFC SKY | Updated at: Apr 9, 2025 04:43 PM IST
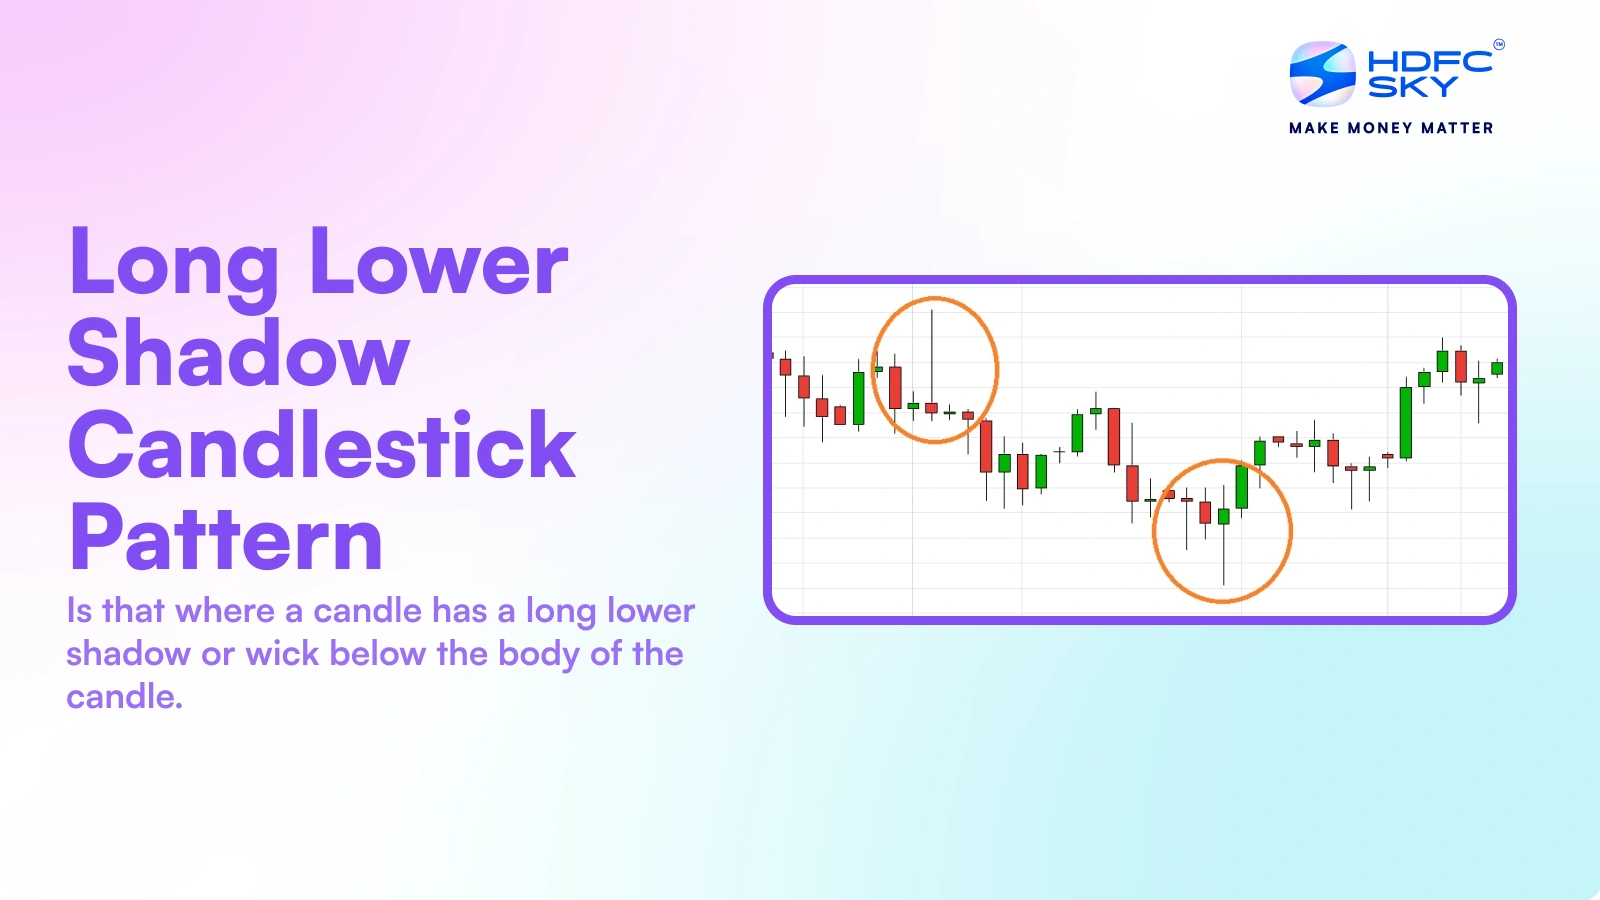
A long lower shadow candlestick pattern is that where a candle has a long lower shadow or wick below the body of the candle. The body of the candle is the thick bar that represents the difference between closing and opening prices of the day. The wick or shadow of a candle is the long vertical line that extends above and below the body of a candle. One essential tool in the arsenal of technical analysis is using candlestick patterns to interpret market sentiment and potential price action. You might already recognise certain patterns forming in price action.
One such pattern is a long lower shadow candlestick which provides information about how the share market behaves and where the trend may change direction. This article covers what is a long lower shadow candlestick pattern and how to use long lower shadow candlestick pattern.
What is a Long Lower Shadow Candlestick?
A long lower shadow candlestick is a type of candlestick formation characterised by a small body at the top of the candle and a long wick or shadow extending below. The long lower shadow indicates that sellers pushed the price down during the trading period, but buyers were able to push it back up, closing near the opening price.
The long shadow candlestick pattern is often seen as a sign of potential bullish reversal, especially at the bottom of a downtrend. It implies that sellers were in charge earlier, but buyers took over and prevailed later, which could indicate a change in market sentiment.
Common Types of Long Lower Shadow Candlesticks
There are a few different types of long lower shadow candle patterns, all with unique characteristics and implications. Let’s look at three common types:
Hammer Candlesticks
The hammer is a popular long lower shadow candlestick pattern. It forms at the bottom of a downtrend and is characterised by a small body at the top of the candle with a long lower shadow that’s at least twice the length of the body. The hammer indicates that despite intense selling pressure, buyers were able to push the price back up, potentially signalling a bullish reversal.
Dragonfly/Long Legged Doji Candlesticks
A dragonfly doji is a special type of trading long shadow candlestick in which the opening and closing prices are the same or very close, creating a tiny body or no body at all. The long lower shadow indicates that sellers pushed the price down during the session, but buyers were able to push it all the way back up to the opening price.
Profit Taking Candlesticks
These candlestick long lower shadow patterns often appear at the end of an uptrend. They indicate that while there was some selling pressure (possibly due to profit-taking), buyers were still present in the market, preventing a complete reversal. This pattern can sometimes present a temporary pause in an uptrend rather than a full reversal.
Now it’s time to explore how to trade long shadow candlesticks.
What Do Long Lower Shadow Candlesticks Indicate?
Long lower shadow candlesticks can provide valuable insights into market psychology and potential future price movements. Here’s what they typically indicate:
- Rejection of Lower Prices: The long lower shadow shows that the market tested lower prices but ultimately rejected them. This can be a sign of strong buying interest at lower levels.
- Potential Bullish Reversal: When appearing at the bottom of a downtrend, these patterns can signal a possible trend reversal. They guide that sellers may be losing steam and buyers are starting to take control.
- Support Levels: The low point of the shadow can often act as a support level in future trading sessions. Traders usually watch these levels for potential bounces.
- Indecision: In some cases, particularly with doji patterns, a long lower shadow candle can indicate market indecision. This might imply a pause in the current trend rather than an immediate reversal.
- Oversold Conditions: In a downtrend, these patterns can sometimes indicate that the market has become oversold and is due for a bounce or reversal.
Example of Long Lower Shadow Candlestick Pattern
Let’s consider a practical example to understand how to identify and interpret a long lower shadow candlestick pattern. Imagine you are analysing the daily chart of a popular Indian stock, say ABC Industries.
You notice that after a prolonged downtrend where the stock price fell from ₹2,573 to ₹2,192, a candlestick forms with the following characteristics:
- Opening price: ₹2,205
- Highest price: ₹2,218
- Lowest price: ₹2,150
- Closing price: ₹2,210
This candlestick has a small body (₹5 difference between open and close) and a long lower shadow (₹55 from the low to the body). This formation means that while sellers initially pushed the price down to ₹2,150, buyers stepped in and pushed it back up to close near the opening price.
If the price rises in the following days, this long lower shadow candlestick will confirm its bullish reversal signal.
Conclusion
The long lower shadow candlestick pattern is a useful technical analysis tool in a trader’s arsenal. It provides clues about market sentiment and potential trend reversals. By knowing what to look for and how to decipher these patterns, traders and investors can make better decisions about future buying and selling opportunities.
However, it’s important to remember that no single pattern should be used in isolation. The long lower shadow candlestick meaning is most reliable when confirmed by other signals and within the context of the broader market trend.
Related Articles
FAQs on Long Lower Shadow Candlestick Pattern
How is a long lower shadow different from other candlestick patterns?
A long lower shadow candlestick may show things more clearly and decisively.. Unlike patterns like doji or spinning tops, which show indecision, the long lower shadow indicates that buyers strongly defended lower prices, potentially signalling a shift in market sentiment.
What timeframes are ideal for analysing long lower shadow candlesticks?
Long lower shadow candlesticks can be analysed on any timeframe, from intraday charts to weekly or monthly charts. However, they are often considered more significant on longer timeframes (daily, weekly), representing more substantial market movements and sentiment shifts.
How does volume affect the interpretation of a long lower shadow candlestick?
Volume plays a crucial role in confirming the significance of a long lower shadow candle. Higher volume accompanying the pattern indicates stronger buyer interest and can increase the reliability of the potential bullish signal. Low volume might indicate less conviction behind the price action.
In what market conditions does a long lower shadow candlestick typically appear?
Long lower shadow candlesticks often appear at the end of downtrends or during periods of consolidation. They can signal potential trend reversals when found at support levels or after extended price declines. These patterns may also form during ranging markets, indicating strong support at lower prices.
What Is the Right Way to Use the Long Lower Shadow Candlestick?
To use the long lower shadow candlestick pattern effectively, consider it in context with other technical indicators and market conditions. Look for confirmation in subsequent candlesticks and watch for increased buying volume. It’s often most reliable when found at key support levels or after extended downtrends.
How to Interpret Long Lower Shadow Candlestick Patterns?
To interpret long shadow candlesticks, traders examine the pattern’s location, associated volume, and follow-up price movement. For example, a long lower shadow at a support level on high volume can indicate a powerful bullish reversal. The next candlestick will tell if selling pressure persists, confirming a weaker bullish signal.
Is the Long Lower Shadow pattern bullish or bearish?
The long lower shadow candlestick pattern is generally considered bullish, especially when it appears at the bottom of a downtrend. It indicates that sellers pushed the price down but buyers were strong enough to push it back up, presenting potential bullish sentiment. However, always confirm with subsequent price action and other indicators.

