- Offerings
- Tools & Platforms
Tools & Calculators
- Open API
- Calculators
- SIP Calculator
- CAGR Calculator
- Compound Interest Calculator
- FD Calculator
- RD Calculator
- EPF Calculator
- Retirement Calculator
- HDFC SIP Calculator
- Mutual Fund Return Calculator
- Lumpsum Calculator
- Step Up SIP Calculator
- ETF SIP Calculator
- Brokerage Calculator
- Equity Margin Calculator
- SWP Calculator
- EMI Calculator
- MTF Calculator
- Pricing
- SKY Learn
- Mutual Funds
- Margin Trading
- Financial Planning
- Personal Finance
- Share Trading
- IPO
- Derivatives
- Currencies
- Intraday Trading
- Trading Strategies
- Demat Account
- Commodity
- ETF
What is MACD in Stock Market? Meaning, Formula and How it Works
By HDFC SKY | Updated at: Oct 29, 2025 05:45 PM IST
The MACD full form is Moving Average Convergence Divergence. It is a popular technical analysis indicator used by traders to identify potential buy and sell signals in stock and other financial markets. By comparing short-term and long-term moving averages, the MACD helps detect trend direction, strength and momentum, making it a vital tool in informed trading decisions.
What is MACD in Stock Market?
MACD meaning in the stock market refers to Moving Average Convergence Divergence, a momentum indicator that shows the relationship between two moving averages of a stock’s price. It helps traders identify potential trend reversals and entry or exit points by analysing the convergence or divergence of short-term and long-term price trends.
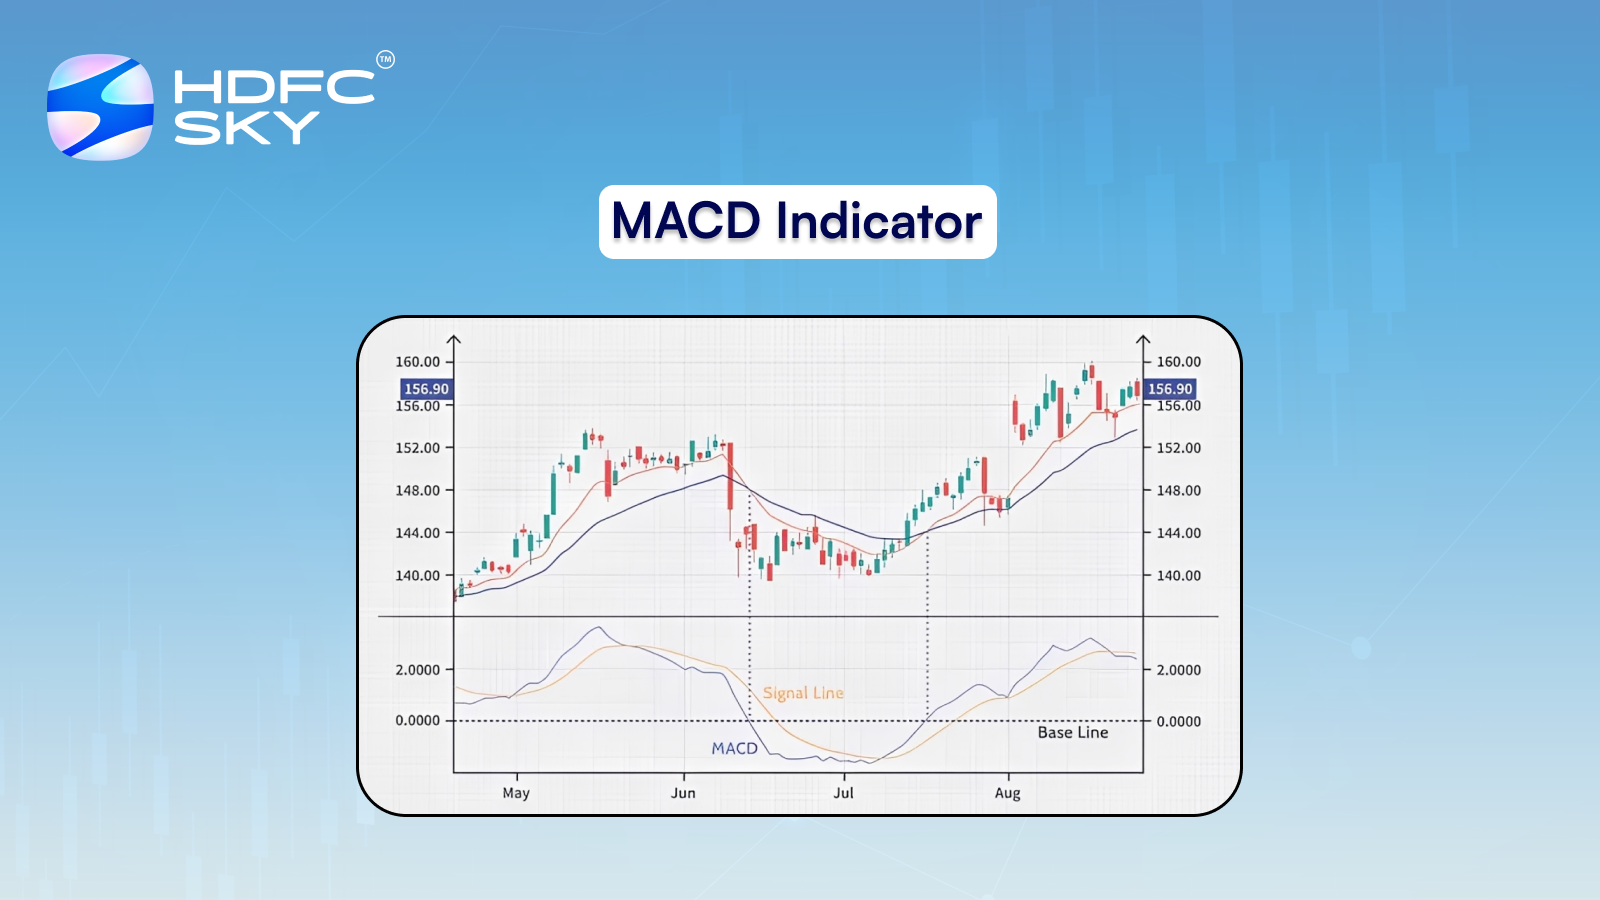
How MACD Works
The MACD works by comparing two moving averages of a security’s price to identify changes in trend momentum. It is calculated by subtracting the 26-period Exponential Moving Average (EMA) from the 12-period EMA, producing the MACD line. A separate 9-period EMA called the signal line is then plotted alongside to help identify trading signals. When the MACD line crosses above the signal line, it may indicate a potential buying opportunity, while a cross below the signal line can suggest a selling opportunity. The histogram which represents the difference between the MACD line and the signal line, visually shows the strength and direction of momentum. This combination of moving averages and histogram allows traders to better understand whether a trend is gaining or losing strength helping them make more informed trading decisions.
How MACD Is Calculated?
MACD (Moving Average Convergence Divergence) is calculated using three components:
- MACD Line = 12-day EMA – 26-day EMA
(EMA = Exponential Moving Average) - Signal Line = 9-day EMA of the MACD Line
(Used to generate buy/sell signals) - MACD Histogram = MACD Line – Signal Line
(Shows the difference between MACD and Signal Line, indicating momentum)
Advantages of MACD
The MACD helps traders easily spot trend direction and momentum using simple visual signals like crossovers and histograms. It works well across different timeframes, making it useful for both short-term and long-term trading.
- Easy to interpret: Uses simple visual elements like lines and histograms to understand market trends.
- Identifies trend direction: Helps determine whether the market is in an uptrend or downtrend.
- Shows momentum strength: Indicates how strong the current price movement is.
- Generates trading signals: Crossovers between the MACD line and signal line suggest potential buy or sell points.
- Works across timeframes: Can be applied to intraday, daily, weekly or monthly charts.
- Effective in trending markets: Performs well in identifying sustained upward or downward moves.
Disadvantages of MACD
The MACD can give delayed signals since it relies on past price data, sometimes causing late entries or exits. It may also produce false signals in sideways or volatile markets if used alone.
- Lagging indicator : Signals are based on past price data and may appear after a trend has started.
- False signals in sideways markets : Can give misleading buy or sell signals during low volatility.
- No overbought or oversold levels : Unlike RSI, MACD doesn’t clearly show extreme price conditions.
- Less effective in choppy markets : Works best in trending conditions, not in unpredictable price swings.
- Requires confirmation : Should be used with other indicators for more reliable trading decisions.
What Problems do MACD Solve?
MACD helps traders overcome the challenge of identifying market trends and momentum accurately. It reduces noise by smoothing price data, making trading decisions clearer and more reliable.
- Identifies trend direction and strength
- Provides early buy and sell signals
- Helps spot potential reversals
- Filters out market noise for better clarity
- Combines momentum and trend-following indicators
Interpretation of MACD
The MACD (Moving Average Convergence Divergence) is a technical analysis indicator that helps traders identify trends, momentum and possible reversals in stock prices.
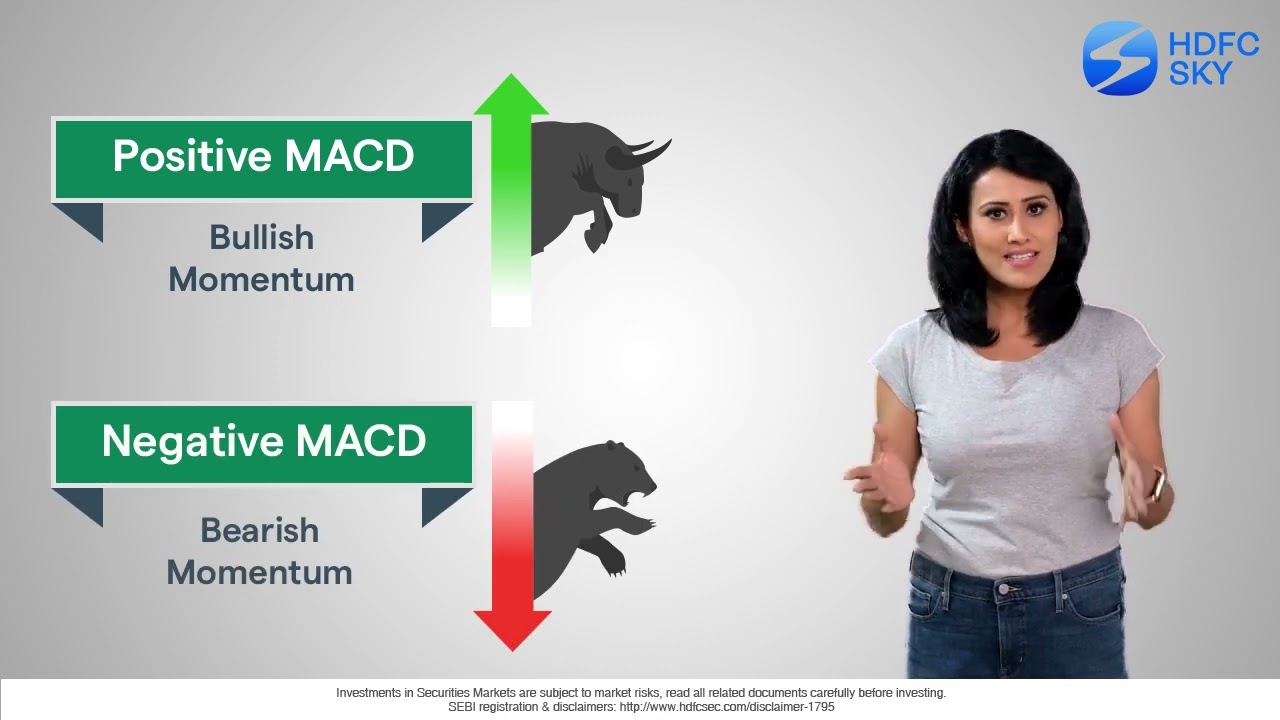
- MACD Line Above Signal Line
- Indicates bullish momentum.
- Suggests a possible buying opportunity.
- MACD Line Below Signal Line
- Indicates bearish momentum.
- Suggests a possible selling opportunity.
- MACD Above Zero Line
- Shows that the short-term average is above the long-term average.
- Signals an overall upward trend.
- MACD Below Zero Line
- Shows that the short-term average is below the long-term average.
- Signals an overall downward trend.
- MACD Crossovers
- Bullish Crossover: MACD line crosses above the signal line.
- Bearish Crossover: MACD line crosses below the signal line.
- MACD Divergence
- Bullish Divergence: Price makes a lower low but MACD makes a higher low could signal an upcoming reversal.
- Bearish Divergence: Price makes a higher high but MACD makes a lower high could signal a potential downtrend.
How to use MACD Indicator?
The MACD indicator is used to identify trend direction and momentum in stock prices. Traders watch for line crossovers and histogram changes to time entries and exits.
- Identify Crossovers: MACD Line crosses above Signal Line: This is a bullish signal suggesting a potential buy opportunity.
MACD Line crosses below Signal Line: This is a bearish signal, indicating a potential sell. - Zero Line Cross: When the MACD crosses above zero it confirms an uptrend.
When it crosses below zero, it signals a downtrend. - Divergence: If the price makes a new high or low that is not confirmed by the MACD, it may suggest a trend reversal is coming.
- Histogram Analysis: The bars represent the difference between the MACD and the Signal Line.
Increasing bars suggest strengthening trend, shrinking bars may indicate weakening momentum.
Always use MACD with other indicators or chart patterns for stronger confirmation.
Is MACD a Leading Indicator or a Lagging Indicator?
The MACD (Moving Average Convergence Divergence) is considered a lagging indicator because it is derived from historical price data, particularly moving averages. It reflects changes that have already occurred in the market rather than predicting future movements. By calculating the difference between two exponential moving averages (typically the 12-day and 26-day EMAs) MACD helps traders identify trend direction, momentum, and potential reversals. However since it responds to price changes with a delay, it is most effective when used in conjunction with other tools or indicators for confirmation. Despite being lagging, MACD remains popular for its clarity in signaling bullish or bearish momentum.
What Is a MACD Bullish/Bearish Divergence?
A MACD bullish divergence occurs when the price of a stock makes a lower low, but the MACD forms a higher low. This suggests weakening downward momentum and can indicate a potential reversal to an uptrend.
A MACD bearish divergence happens when the price makes a higher high but the MACD makes a lower high. This signals that upward momentum is fading and may suggest an upcoming downtrend.
Both divergences are used by traders to spot early signs of trend reversals.
Conclusion
The MACD indicator is a powerful, versatile tool that helps traders assess trend strength, momentum and potential entry/exit points. By combining the MACD line, signal line, and histogram, it offers a clear picture of price movement. While it’s easy to use and effective across timeframes, traders should remember that it’s lagging and may produce false signals in sideways markets. For best results use MACD with other technical indicators to confirm signals and make confident, data-backed trading decisions.
Related Articles
FAQs
How is MACD calculated?
MACD Line = 12-day EMA – 26-day EMA; Signal Line = 9-day EMA of MACD Line; Histogram = MACD – Signal Line.
How can I use MACD in trading?
Combine MACD crossovers, divergences and histogram signals with other tools like RSI for better confirmation.
How do traders use MACD?
Traders use the MACD to identify trend direction, momentum, and potential entry or exit points. Common strategies include watching for signal line crossovers, where the MACD line crosses above (bullish) or below (bearish) the signal line, and divergences, where price movement disagrees with MACD trends, indicating possible reversals.
What is MACD Indicator?
The MACD (Moving Average Convergence Divergence) is a momentum and trend-following indicator used in technical analysis. It shows the relationship between two moving averages of a stock’s price typically the 12-day and 26-day exponential moving averages (EMAs). Traders use MACD to identify potential buy or sell signals through crossovers, divergences, and histogram movements.
What is MACD in Stock Market?
MACD (Moving Average Convergence Divergence) is a popular technical indicator used to identify trend direction and momentum by comparing short-term and long-term moving averages of a stock’s price.

