- Offerings
- Tools & Platforms
Tools & Calculators
- Open API
- Calculators
- SIP Calculator
- CAGR Calculator
- Compound Interest Calculator
- FD Calculator
- RD Calculator
- EPF Calculator
- Retirement Calculator
- HDFC SIP Calculator
- Mutual Fund Return Calculator
- Lumpsum Calculator
- Step Up SIP Calculator
- ETF SIP Calculator
- Brokerage Calculator
- Equity Margin Calculator
- SWP Calculator
- EMI Calculator
- MTF Calculator
- Pricing
- SKY Learn
- Mutual Funds
- Margin Trading
- Financial Planning
- Personal Finance
- Share Trading
- IPO
- Derivatives
- Currencies
- Intraday Trading
- Trading Strategies
- Demat Account
- Commodity
- ETF
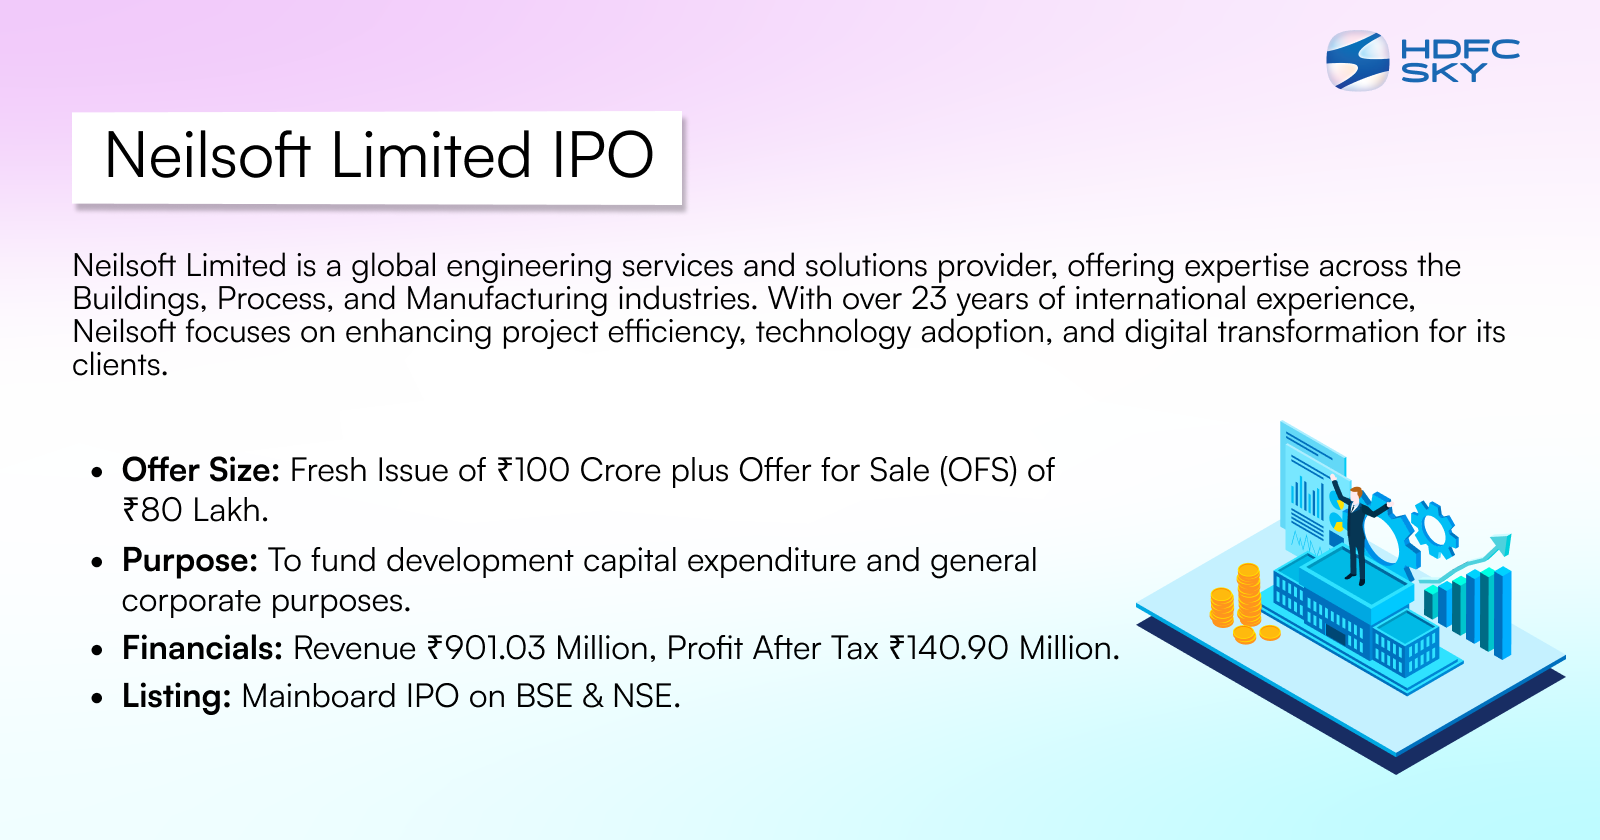
Neilsoft Limited IPO
To be Announced
Minimum Investment
IPO Details
TBA
TBA
TBA
TBA
TBA
NSE, BSE
TBA
TBA
Neilsoft Limited IPO Timeline
Bidding Start
TBA
Bidding Ends
TBA
Allotment Finalisation
TBA
Refund Initiation
TBA
Demat Transfer
TBA
Listing
TBA
Neilsoft Limited IPO
Neilsoft, based in Pune, India, is a global Engineering Services and Solutions provider with over 1,400 professionals. It serves clients in the Buildings, Process, and Manufacturing industries, aiming to enhance project efficiency, boost technology adoption, and enable digital transformation. With 23+ years of international experience, Neilsoft excels in delivering integrated, multi-disciplinary services for diverse sectors worldwide.
The company is committed to client satisfaction, ensuring timeliness, accuracy, and long-term partnerships. Its distinguishing traits include high integrity, a multi-cultural mindset, and a dedication to meeting commitments using all necessary resources.
Neilsoft’s skilled engineering team comprises professionals across various disciplines, experienced in tools, platforms, and project management methodologies. Their expertise in handling international projects positions Neilsoft as a trusted partner in driving efficiency and innovation for clients globally.
Neilsoft Limited IPO Overview
Neilsoft IPO is a bookbuilding issue comprising a fresh issue of ₹100.00 crore and an offer for sale of 0.80 crore shares. The IPO dates are yet to be announced, with the allotment expected to be finalized soon, and the price band details are still awaited. Equirus Capital Private Limited and IIFL Securities Ltd are the book-running lead managers for the issue, while Link Intime India Private Ltd is acting as the registrar. The IPO will have a face value of ₹5 per share and will be listed on BSE and NSE. The total issue size, lot size, and aggregate value will be confirmed later. The company’s pre-issue shareholding stands at 3,74,99,155 shares, with promoters Ketan Champaklal Bakshi, Rupa Harish Shah, and Daksha Bakshi holding a 54.69% pre-issue stake. Post-issue shareholding will reflect the equity dilution
Neilsoft Limited Upcoming IPO Details
| Category | Details |
| Issue Type | Book Built Issue IPO |
| Total Issue Size | Fresh Issue: ₹100 crore
Offer for Sale (OFS): ₹80 lakh |
| IPO Dates | TBA |
| Price Bands | TBA |
| Lot Size | TBA |
| Face Value | ₹5 per share |
| Listing Exchange | BSE, NSE |
| Shareholding pre-issue | 3,74,99,155 shares |
| Shareholding post -issue | TBA |
Neilsoft Limited IPO Lots
| Application | Lots | Shares | Amount |
| Retail (Min) | TBA | TBA | TBA |
| Retail (Max) | TBA | TBA | TBA |
| S-HNI (Min) | TBA | TBA | TBA |
| S-HNI (Max) | TBA | TBA | TBA |
| B-HNI (Min) | TBA | TBA | TBA |
| Investor Category | Shares Offered |
| QIB Shares Offered | Not less than 75% of the Net Offer |
| Retail Shares Offered | Not more than 10% of the Net Offer |
| NII (HNI) Shares Offered | Not more than 15% of the Net Offer |
Neilsoft Limited IPO Valuation Overview
| KPI | Value |
| Earnings Per Share (EPS) | 15.52 |
| Price/Earnings (P/E) Ratio | TBD |
| Return on Net Worth (RoNW) | 23.85% |
| Net Asset Value (NAV) | 69.87 |
| Return on Equity | 22.21% |
| Return on Capital Employed (ROCE) | 18.23% |
| EBITDA Margin | 21.87% |
| PAT Margin | 17.18% |
| Debt to Equity Ratio |
Objectives of the IPO Proceeds
The Net Proceeds are intended to be utilised as per the details provided in the table below:
| Particulars | Amount (in ₹ million) |
| Funding development capital expenditure | 696.30 |
| General corporate purposes* | [●] |
Note: *To be determined upon finalisation of the Offer Price and updated in the Prospectus prior to filing with the RoC
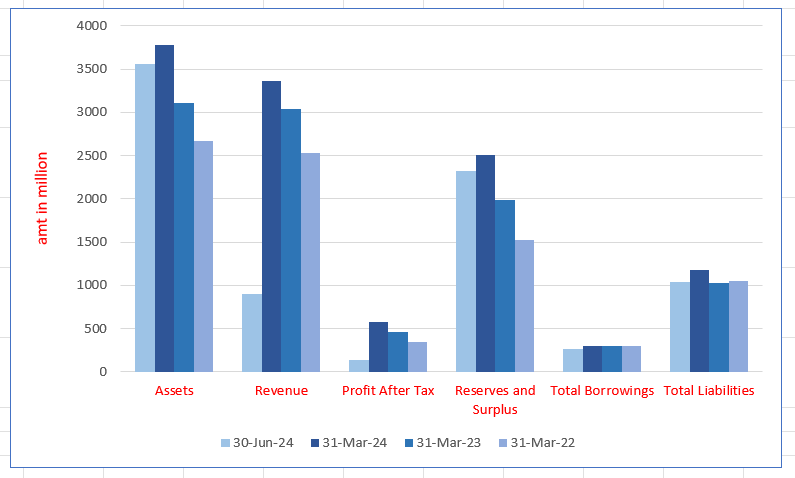
Neilsoft Limited Financials (in million)
| Particulars | 30 June 2024 | 31 Mar 2024 | 31 Mar 2023 | 31 Mar 2022 |
| Assets | 3553.26 | 3781.05 | 3106.28 | 2669.22 |
| Revenue | 901.03 | 3366.99 | 3039.56 | 2534.01 |
| Profit After Tax | 140.90 | 578.54 | 466.39 | 347.91 |
| Reserves and Surplus | 2325.78 | 2511.57 | 1987.05 | 1528.73 |
| Total Borrowings | 260.01 | 297.65 | 300.86 | 302.53 |
| Total Liabilities | 1041.08 | 1176.28 | 1026.03 | 1047.29 |
Financial Status of Neilsoft Limited
SWOT Analysis of Neilsoft Limited IPO
Strength and Opportunities
- Established in 1993, Neilsoft has over 30 years of experience in engineering services.
- Headquartered in Pune, India, with a global presence, including offices in the USA, Europe, and Asia-Pacific.
- Employs over 1,200 professionals, offering a diverse pool of engineers across multiple disciplines.
- Provides a broad range of engineering solutions and technology expertise across multiple sectors.
- Strong execution capabilities with a track record of successfully completing prestigious projects.
- Focuses on improving clients' engineering efficiency and supporting their global footprint.
- Offers services in infrastructure, building design, and other engineering sectors, providing diversification.
- Maintains a strong marketing and sales network with multiple offices worldwide.
- Holds ISO 9001:2000 and ISO 27001:2005 certifications, demonstrating commitment to quality and information security.
- Engages in the business of selling software products, adding an additional revenue stream.
- Strong financial performance with healthy profitability margins and a comfortable capital structure.
Risks and Threats
- The engineering and design services market is highly competitive, with numerous domestic and international players.
- Approximately 50% of revenue is derived from the infrastructure and building design segments, indicating sector concentration.
- Significant revenue concentration in the USA and European markets exposes the company to geopolitical and economic risks.
- Exposure to foreign exchange fluctuations due to international operations and revenue streams.
- Short-term nature of contracts may lead to revenue volatility and challenges in long-term planning.
- Dependence on key clients could impact revenue stability if major clients are lost.
- Rapid technological advancements require continuous investment in new tools and training.
- Regulatory changes in offshore markets could affect operations and profitability.
- High competition may pressure profit margins and necessitate competitive pricing strategies.
- Talent retention in a competitive industry is crucial to maintaining service quality and client satisfaction.
- Economic downturns in key markets could lead to reduced client spending on engineering services.
Explore IPO Opportunities
Explore our comprehensive IPO pages to stay updated on the latest trends and insights.
All About Neilsoft Limited IPO
More About Neilsoft Limited
Neilsoft Limited, a distinguished engineering research and development (ER&D) company, delivers cutting-edge solutions across Architecture, Engineering, and Construction (AEC), Manufacturing, and Industrial Plant sectors. Established in 1991, the company leverages advanced technologies to offer tailored services and solutions that drive digital transformation.
Industry Landscape
- India’s outsourced ER&D market, valued at USD 51 billion in 2023, is anticipated to grow at a CAGR of 20.7%, reaching USD 189 billion by 2030.
- Neilsoft is well-positioned to capitalise on this dynamic growth.
Core Offerings
Engineering Services
- AEC: Comprehensive design services, including architecture, civil/structural, MEPF, and BIM for buildings, infrastructure, and plants.
- Industrial Plants: Expertise in plant design, automation, and digitisation.
- Manufacturing: Solutions for production line and equipment design, along with PLC programming.
- Engineering Process Outsourcing (EPO): Streamlining engineering processes to enhance efficiency.
Engineering Solutions
- Proprietary products like CADISON® for plant engineering and E&I Electrical Designer.
- Authorised reseller of Autodesk and Bluebeam software for AEC and manufacturing industries.
Revenue Breakup from Engineering Services and Engineering Solutions
- 3 Months Ended June 30, 2024
- Engineering Services: ₹662.32M (75.06%)
- Engineering Solutions: ₹220.10M (24.94%)
- Total: ₹882.42M (100%)
- Fiscal 2024
- Engineering Services: ₹2,363.17M (72.52%)
- Engineering Solutions: ₹895.36M (27.48%)
- Total: ₹3,258.53M (100%)
- Fiscal 2023
- Engineering Services: ₹2,046.68M (70.32%)
- Engineering Solutions: ₹863.64M (29.68%)
- Total: ₹2,910.32M (100%)
- Fiscal 2022
- Engineering Services: ₹1,610.36M (64.86%)
- Engineering Solutions: ₹872.53M (35.14%)
- Total: ₹2,482.89M (100%)
Revenue by End User Industry
- 3 Months Ended June 30, 2024
- AEC: ₹511.54M (57.97%)
- Manufacturing: ₹215.77M (24.45%)
- Industrial Plants: ₹155.11M (17.58%)
- Total: ₹882.42M (100%)
- Fiscal 2024
- AEC: ₹1,859.82M (57.08%)
- Manufacturing: ₹684.98M (21.02%)
- Industrial Plants: ₹713.73M (21.90%)
- Total: ₹3,258.53M (100%)
- Fiscal 2023
- AEC: ₹1,716.19M (58.97%)
- Manufacturing: ₹582.16M (20.00%)
- Industrial Plants: ₹611.97M (21.03%)
- Total: ₹2,910.32M (100%)
- Fiscal 2022
- AEC: ₹1,268.52M (51.09%)
- Manufacturing: ₹620.17M (24.98%)
- Industrial Plants: ₹594.20M (23.93%)
- Total: ₹2,482.89M (100%)
Revenue by Customer Location
- 3 Months Ended June 30, 2024
- Americas: ₹328.27M (37.20%)
- Europe: ₹221.23M (25.07%)
- Asia-Pacific: ₹137.18M (15.55%)
- India: ₹191.51M (21.70%)
- Rest of World: ₹4.23M (0.48%)
- Total: ₹882.42M (100%)
- Fiscal 2024
- Americas: ₹1,330.10M (40.82%)
- Europe: ₹849.73M (26.08%)
- Asia-Pacific: ₹346.55M (10.64%)
- India: ₹718.01M (22.03%)
- Rest of World: ₹14.14M (0.43%)
- Total: ₹3,258.53M (100%)
- Fiscal 2023
- Americas: ₹1,239.22M (42.58%)
- Europe: ₹847.35M (29.12%)
- Asia-Pacific: ₹123.04M (4.23%)
- India: ₹679.03M (23.33%)
- Rest of World: ₹21.68M (0.74%)
- Total: ₹2,910.32M (100%)
- Fiscal 2022
- Americas: ₹1,007.17M (40.56%)
- Europe: ₹713.88M (28.75%)
- Asia-Pacific: ₹79.66M (3.21%)
- India: ₹651.30M (26.23%)
- Rest of World: ₹30.88M (1.25%)
- Total: ₹2,482.89M (100%)
Engineering Services Contracts
- Fixed-Price Contracts
- 3 Months Ended June 30, 2024: ₹215.11M (32.48%)
- Fiscal 2024: ₹583.70M (24.70%)
- Fiscal 2023: ₹392.64M (19.18%)
- Fiscal 2022: ₹277.30M (17.22%)
- Time-and-Material (T&M) Contracts
- 3 Months Ended June 30, 2024: ₹447.21M (67.52%)
- Fiscal 2024: ₹1,779.47M (75.30%)
- Fiscal 2023: ₹1,654.04M (80.82%)
- Fiscal 2022: ₹1,333.06M (82.78%)
Global Presence
- Delivery centres in Pune, Bengaluru, Ahmedabad, Germany, and Japan.
- Subsidiaries and sales offices in the US, UK, Canada, Germany, and Switzerland.
Workforce and Innovation
- 1,429 skilled employees, with 48 dedicated to R&D.
- Advanced capabilities in AI/ML, IoT, and Computer Vision ensure sustainable and cost-effective solutions.
Neilsoft, with its robust leadership and innovative services, remains a trusted partner in transforming global engineering landscapes.
Industry Outlook
Growing Impact of ER&D Services: Innovation and Market Expansion
The global ER&D services market, valued at USD 1,692 billion in 2023, outpaces IT services with an 8.6% CAGR (2023–2030). These services drive innovation through advanced technologies like IoT, AI, and robotics, addressing complex challenges. Focused on sustainability and digital transformation, ER&D services blend engineering expertise with eco-friendly solutions, making them indispensable for enterprises striving for market leadership and innovation.
The rising demand for digital transformation across industries like manufacturing, healthcare, and automotive has spurred ER&D outsourcing for expertise, cost efficiency, and speed. GenAI applications in design and operations are emerging as transformative drivers, reshaping digital engineering capabilities and services.
ER&D Services Market Dynamics
- Technology Adoption: Rapid adoption of BIM, AR, VR, IoT, AI, and robotics in AEC and manufacturing enhances efficiency and precision.
- Talent Shortage: A shortage of skilled professionals drives ER&D outsourcing for specialized expertise and upskilling.
- Global Economic Shifts: Geopolitical tensions and the shift to resilience make India an attractive destination for ER&D activities.
- Local Sourcing: Companies are localizing sourcing strategies, with India benefiting from a strong manufacturing base.
- Energy Transition: ER&D services support sustainability efforts through energy management and green building design.
ER&D Services Market Opportunities
- Carbon Mitigation & Emissions Management: Demand for carbon reduction technologies is growing, creating opportunities for ER&D in developing low-emission and energy-efficient systems.
- Modernization of Infrastructure: Aging infrastructure requires upgrades, creating a market for intelligent, data-driven infrastructure solutions.
- Sustainability & Infrastructure Synergies: Combining sustainability with infrastructure modernization offers integrated engineering solutions to minimize environmental impact and improve efficiency.
Global ER&D Services Spend by Industry Vertical
In 2023, the global ER&D services market was valued at USD 639 billion, with projections to reach USD 1,163 billion by 2030, reflecting an 8.9% CAGR.
- Manufacturing: Dominates the market, focusing on product design, development, and production optimization.
- Construction: Set to grow at 10.1% CAGR, reaching USD 72.5 billion by 2030.
- Process/Industrial Plants: Expected to grow from USD 273.4 billion to USD 514.5 billion by 2030, at a 9.5% CAGR.
India & Global ER&D Services Spend by Region
India’s ER&D market is set to grow from USD 57.7 billion in 2023 to USD 205.2 billion by 2030, at a CAGR of 19.9%. This growth is driven by India’s skilled talent, cost advantages, and multinational companies setting up R&D centres. The global ER&D services market shows growth across regions like North America, Europe, and APAC.
Global Outsourced ER&D Market:
- ESPs: Valued at USD 103.4 billion in 2023, expected to reach USD 320.2 billion by 2030, with a CAGR of 17.1%.
- GCCs: Growing at a CAGR of 16.4%, with significant contributions from IT companies like TCS, Wipro, and Tech Mahindra.
- Key drivers: Strong demand for specialized engineering solutions and integrated IT services.
India’s Outsourced ER&D Market:
- Valued at USD 51 billion in 2023, projected to reach USD 189 billion by 2030, with a CAGR of 20.7%.
- GCCs: Largest segment with USD 25.9 billion in 2023, driving innovation and efficiency
Global Engineering Design Services Industry Overview
- Market Growth: Estimated at USD 375.8 billion in 2023, projected to reach USD 535.5 billion by 2030, with a CAGR of 5.2%.
- Key Sectors: Automotive, aerospace, industrial machinery, consumer electronics, energy, oil & gas, telecommunications, construction.
- Key Disciplines: Architecture, mechanical, civil, electrical, chemical engineering.
- Market Drivers: Technological advancements, urbanization, demand for sustainable and efficient solutions.
- Manufacturing Growth: Expansion of manufacturing sectors, automation, and smart technologies boost demand for engineering design services.
Global BIM Market Overview
- Growth Opportunity: BIM is a rapidly expanding segment in global ER&D spend.
- Technology: Involves digital modelling of physical and functional characteristics of buildings/facilities.
- Collaboration: Enhances teamwork among architects, engineers, and other professionals.
- Digital Twin: Integrates physical and digital worlds for improved insights.
- Market Size: USD 5.1B in 2020, expected to reach USD 19.6B by 2030.
- Global Adoption: Strong presence in North America, Europe, and growing in APAC.
Global Market for Plant Engineering Software
- Plant Engineering Software Market: Focuses on tools for designing and managing industrial plants.
- Growth Forecast: Expected CAGR of 12.2% from 2024-2030, with a market size of USD 8.6 Bn by 2030.
- Key Growth Drivers:
- Demand for automation and enhanced operational efficiency
- Industry 4.0 and digital transformation adoption
- Increased regulatory compliance and safety requirements
- Future Trends: Cloud-based solutions, AI/ML integration, and eco-friendly technologies.
How Will Neilsoft Limited Benefit?
- Leveraging Digital Technologies
As industries continue to embrace technologies such as IoT, AI, robotics, and automation, Neilsoft’s expertise in providing digital and automated solutions aligns well with the increasing market need. By utilizing digitalization and automation in the AEC, manufacturing, and industrial plants sectors, Neilsoft is poised to help businesses enhance efficiency and reduce costs, a key requirement in today’s competitive landscape.
- Global ER&D Market Growth
The global ER&D services market is expected to grow significantly, driven by technological advancements and the push for sustainability. With a projected market value of USD 1,692 billion in 2023, expanding at a CAGR of 8.6%, Neilsoft’s presence in this space is likely to expand as the demand for engineering design services, BIM, and smart technologies continues to rise. The company’s established capabilities in AEC and BIM services position it as a key player, especially in the rapidly evolving infrastructure and manufacturing sectors.
- India’s Growing ER&D Outsourcing
India’s ER&D market, valued at USD 57.7 billion in 2023, is expected to grow at a CAGR of 19.9% by 2030. As one of the top outsourcing destinations for ER&D services, Neilsoft benefits from the cost advantages, skilled workforce, and strategic location of India. With multinational companies increasingly looking to set up R&D centres in India, Neilsoft’s role in offering specialized expertise and solutions across its core industries will strengthen.
- Proprietary Solutions for Competitive Edge
Neilsoft’s proprietary solutions, such as CADISON for plant design and BIM, set it apart from competitors. These solutions allow for customization, which is highly valued by clients in sectors like manufacturing, process plants, and construction. This unique offering not only enhances Neilsoft’s productivity but also provides a significant competitive advantage in a crowded marketplace.
- Sustainability and Green Technologies
As sustainability becomes a key driver across industries, Neilsoft’s focus on green building design, energy management, and decarbonization efforts aligns with the rising demand for carbon reduction technologies. The company’s expertise in energy-efficient and sustainable engineering solutions positions it to cater to the growing need for eco-friendly practices in manufacturing and infrastructure.
- Industry 4.0 and Manufacturing Demand
With the adoption of Industry 4.0 technologies and the increasing demand for smart factories, Neilsoft’s domain knowledge in factory automation and production line ER&D activities puts it at the forefront of the industry. Additionally, the China+1 strategy and Make in India initiatives have led to an increased demand for new manufacturing facilities, further driving growth in this segment.
- Target Market Expansion
The overall target market opportunity for Neilsoft is projected to reach USD 134 billion by 2030, growing at a CAGR of 20%. The combination of digital transformation across AEC, manufacturing, and plant engineering segments, coupled with sustainability-driven investments, presents substantial growth potential for the company. Furthermore, Neilsoft’s strategic market focus in key regions such as North America, Europe, and APAC offers opportunities for global expansion.
Peer Group Comparison
| Name of Company | Face Value
(₹ ) |
P/E | Basic EPS | RoNW (%) | NAV
(₹) |
Total Income
(₹ in million) |
| Neilsoft Limited | 5.00 | NA | 15.52 | 23.85% | 69.87 | 3,366.99 |
| KPIT Technologies | 10.00 | 70.44 | 21.95 | 27.67% | 79.21 | 49,318.08 |
| Onward Technologies Limited | 10.00 | 22.52 | 15.13 | 16.37% | 92.37 | 4,796.64 |
| Cyient Limited | 5.00 | 33.71 | 62.24 | 15.42% | 415.38 | 72,131.00 |
| L&T Technology Services Ltd. | 2.00 | 43.90 | 123.34 | 24.43% | 505.95 | 98,546.00 |
| Tata Technologies Limited | 2.00 | 56.09 | 16.75 | 21.09% | 79.40 | 52,327.50 |
Key Insights
- Face Value: The face value of shares ranges from ₹2.00 to ₹10.00 across companies. Neilsoft Limited has a ₹5.00 face value, while Onward Technologies and KPIT Technologies have ₹10.00. L&T Technology Services and Tata Technologies have a ₹2.00 face value, indicating broader share distribution.
- P/E Ratio: KPIT Technologies leads with a high P/E ratio of 70.44, indicating strong investor expectations. L&T Technology Services and Tata Technologies follow with ratios of 43.90 and 56.09. Cyient Limited has a moderate P/E of 33.71, and Onward Technologies reports 22.52, reflecting market performance.
- Basic EPS: Cyient Limited leads with a high Basic EPS of ₹62.24, reflecting strong profitability. L&T Technology Services follows with ₹123.34. KPIT Technologies reports ₹21.95, while Onward Technologies has ₹15.13. Neilsoft Limited has a basic EPS of ₹15.52, indicating moderate profitability compared to peers.
- RoNW: RoNW shows profitability in relation to net worth. KPIT Technologies has the highest RoNW at 27.67%, indicating robust returns. L&T Technology Services follows with 24.43%. Neilsoft Limited reports 23.85%, Tata Technologies 21.09%, and Cyient Limited reports the lowest at 15.42%, showing varying performance.
- NAV: L&T Technology Services has the highest NAV of ₹505.95, indicating strong asset value per share. Cyient Limited follows with ₹415.38, suggesting considerable asset base. Tata Technologies has ₹79.40, Onward Technologies ₹92.37, and KPIT Technologies ₹79.21, with Neilsoft Limited reporting ₹69.87.
Neilsoft Limited IPO Strengths
- Deep Domain Expertise & Strong Engineering Capabilities
Neilsoft Limited has developed deep domain expertise over the years, particularly in engineering and software solutions. This extensive knowledge has been applied across multiple sectors, including AEC & BIM, manufacturing, and industrial plants. The company excels in using advanced CAD/BIM engineering tools and APIs, which enhances the value it provides to customers worldwide, establishing long-term relationships through its specialized solutions.
- Proprietary Solutions for Enhanced Value Creation
Neilsoft Limited has pioneered several proprietary solutions like CADISON® and E&I Electrical Designer. These innovations help the company provide customized services and solutions that boost efficiency and productivity. By leveraging its unique solutions, Neilsoft delivers high-value outcomes for clients, improving processes across various sectors, including AEC, manufacturing, and industrial plants, while also generating recurring revenue streams.
- Proven Track Record of Financial Performance & Growth
With over two decades of expertise, Neilsoft has consistently demonstrated robust financial performance. The company’s strong track record includes maintaining a high percentage of repeat business, showcasing its ability to retain customers. The combination of domain expertise, technical proficiency, and a well-established reputation has contributed to its steady revenue growth, ensuring the sustainability of its business model in a competitive market.
- Long-Standing Relationships with Global Marquee Clients
Neilsoft Limited has fostered enduring relationships with key multinational and Indian customers. The company’s ability to provide specialized engineering services tailored to specific client needs has solidified its place as a trusted partner in the industry. With over 10 years of continuous business with many clients, Neilsoft’s commitment to high-quality services has translated into reliable long-term partnerships.
- Experienced Leadership Team & Senior Management
Neilsoft’s Board of Directors and senior management team possess vast industry experience and expertise. Their leadership drives the company’s strategic vision and operational execution, ensuring the delivery of top-notch engineering solutions. This seasoned management team plays a critical role in steering the company through evolving market dynamics, maintaining operational excellence and enhancing the company’s competitive advantage.
Key Insights from Financial Performance
- Assets: The total assets have seen fluctuations across the periods. As of 30 June 2024, assets stand at 3553.26, a decrease from 3781.05 in March 2024. This is higher than 3106.28 in March 2023 and significantly up from 2669.22 in March 2022.
- Revenue: Revenue peaked significantly in the quarter ending 31 March 2024, reaching 3366.99. This contrasts with the 901.03 reported in June 2024, showing a decline. However, the revenue figures of 3039.56 in March 2023 and 2534.01 in March 2022 indicate consistent growth overall.
- Profit After Tax (PAT): The profit after tax (PAT) has been strong, with 140.90 recorded in June 2024. While lower than 578.54 in March 2024, it represents a positive trend compared to 466.39 in March 2023 and 347.91 in March 2022, indicating steady profitability.
- Reserves and Surplus: Reserves and surplus reached 2325.78 by 30 June 2024, down from 2511.57 in March 2024. However, it shows growth compared to the 1987.05 in March 2023 and 1528.73 in March 2022, indicating the company’s ability to accumulate retained earnings.
- Total Borrowings: Total borrowings slightly decreased to 260.01 in June 2024, from 297.65 in March 2024. While slightly lower than the 300.86 in March 2023, borrowings have remained relatively stable over the last few periods, indicating controlled debt management with only minor fluctuations.
- Total Liabilities: Total liabilities stood at 1041.08 in June 2024, showing a reduction from 1176.28 in March 2024. Though there was a dip compared to 1026.03 in March 2023, liabilities have remained consistent, indicating a relatively stable financial position with minor variations across the periods.
Other Financial Details
- Employee Benefit Expenses: Employee benefit expenses saw a considerable decline in June 2024 (435.14) compared to the previous fiscal year. The decrease may be attributed to reduced hiring or a decline in employee-related benefits, suggesting tighter cost control or workforce restructuring.
- Finance Cost: The finance cost decreased to 7.39 for the period ending June 30, 2024, from 25.35 in March 2024, indicating a reduction in the company’s debt or financing costs. This highlights the company’s improving financial position and lower interest expenses.
- Depreciation and Amortisation Expense: The depreciation and amortisation expense remained consistent with a slight decrease in June 2024. This suggests that the company’s capital assets remained largely stable without significant additions, reducing the need for higher depreciation charges during the period.
- Impairment of Goodwill on Consolidation: No impairment of goodwill was reported in the period ending June 30, 2024, and the expense for March 2024 reflects a minor write-off. This indicates minimal impact on the company’s goodwill, signifying stable valuation of consolidated assets.
- Other Expenses: Other expenses saw a decrease to 141.27 in June 2024, indicating tighter control over miscellaneous operating costs. This trend demonstrates efficient expense management, contributing to overall cost reductions and improving profitability for the period.
Key Strategies for Neilsoft Limited
- Focused Major Accounts Program and Key Accounts Expansion
Neilsoft Limited has introduced a focused ‘Key Accounts Program’ targeting 40 existing global customers. This program aims to deepen customer relationships through cross-selling. Additionally, the company has launched a ‘Major Accounts Program’ to strategically engage large clients in sectors such as AEC, manufacturing, and industrial plants. The goal is to generate substantial annual revenues and expand the customer base globally, with dedicated teams and senior sales resources deployed across key markets like the US, Europe, and India.
- Expansion of Geographies and Onshore Delivery Centres
Neilsoft Limited plans to enhance its on-shore delivery capabilities to better serve local markets, focusing on hiring regional talent, offering higher-value services, and improving client collaboration. The company aims to expand its delivery presence in India and key international markets like Japan, Germany, Mexico, and the US. By increasing offshore capacity and establishing new delivery centres, Neilsoft seeks to cater to growing demand in global ER&D services, tapping into emerging markets and contributing to business growth.
- Expansion of Offerings and Proprietary Technology-Driven Solutions
Neilsoft Limited focuses on expanding its proprietary solutions in engineering services to differentiate itself in the market. The company is investing in new technology solutions, such as Gen AI and digital twins, aimed at transforming product design, engineering, and manufacturing processes. By enhancing offerings across the Design-Build-Operate phases, Neilsoft anticipates significant market growth. This strategy includes developing new platforms in areas like quality inspection, energy management, and asset maintenance to meet rising demand in smart infrastructure and manufacturing automation.
How to apply IPO with HDFC SKY?
Follow these simple steps to apply for an IPO through HDFC SKY. Secure your investments and explore new opportunities with ease by accessing the IPOs available on the platform.
1Login to your HDFC SKY Account
2Select Issue
3Enter Number of Lots and your Price.
4Enter UPI ID
5Complete Transaction on Your UPI App
FAQs On Neilsoft Limited IPO
What is the issue size of the Neilsoft IPO?
The Neilsoft IPO consists of a fresh issue of ₹100 crore, along with an offer for sale (OFS) of ₹80 lakh. This will provide capital for development and corporate purposes.
What is the listing platform for Neilsoft IPO?
Neilsoft Limited IPO will be listed on both the BSE (Bombay Stock Exchange) and NSE (National Stock Exchange) upon completion of the offer and listing process.
What is the tentative IPO timeline for Neilsoft Limited?
The IPO timeline, including bidding start and end dates, allotment finalisation, refund initiation, and listing, is yet to be announced. All dates are to be determined prior to the filing.
What are the net proceeds from the Neilsoft IPO used for?
The net proceeds from the Neilsoft IPO will primarily be used for funding development capital expenditure of ₹696.30 million, with a portion allocated for general corporate purposes.
How can I apply for the Neilsoft IPO?
Investors can apply for the Neilsoft IPO once the bidding dates are announced through online platforms, brokers, or by submitting physical applications at designated centers.
What is the maximum investment amount for the Neilsoft IPO?
The maximum investment amount for the Neilsoft IPO will be disclosed once the offer price is finalised. Further details regarding lot size and price range will be updated prior to the offering.

