- Offerings
- Tools & Platforms
Tools & Calculators
- Open API
- Calculators
- SIP Calculator
- CAGR Calculator
- Compound Interest Calculator
- FD Calculator
- RD Calculator
- EPF Calculator
- Retirement Calculator
- HDFC SIP Calculator
- Mutual Fund Return Calculator
- Lumpsum Calculator
- Step Up SIP Calculator
- ETF SIP Calculator
- Brokerage Calculator
- Equity Margin Calculator
- SWP Calculator
- EMI Calculator
- MTF Calculator
- Pricing
- SKY Learn
- Mutual Funds
- Margin Trading
- Financial Planning
- Personal Finance
- Share Trading
- IPO
- Derivatives
- Currencies
- Intraday Trading
- Trading Strategies
- Demat Account
- Commodity
- ETF
What is On-Neck Candlestick Pattern? How to Identify It
By HDFC SKY | Updated at: Jul 24, 2025 06:06 PM IST
- The On-Neck Candlestick Pattern is a bearish continuation pattern formed during downtrends.
- It consists of two candles:
- A long bearish candle
- Followed by a smaller bullish candle that opens below the first and closes near or at the first candle’s close.
- The second candle’s close being “on the neck” of the previous bearish candle indicates weak buying pressure, failing to reverse the trend.
- This pattern signals that bears remain in control, increasing the likelihood of continued price declines.
- Traders use it to confirm selling positions or enter short trades, often in conjunction with volume analysis or momentum indicators.
- The pattern works best when supported by other technical confirmations and occurs within a clearly established downtrend.
- Suitable for traders focusing on trend continuation setups in technical analysis.
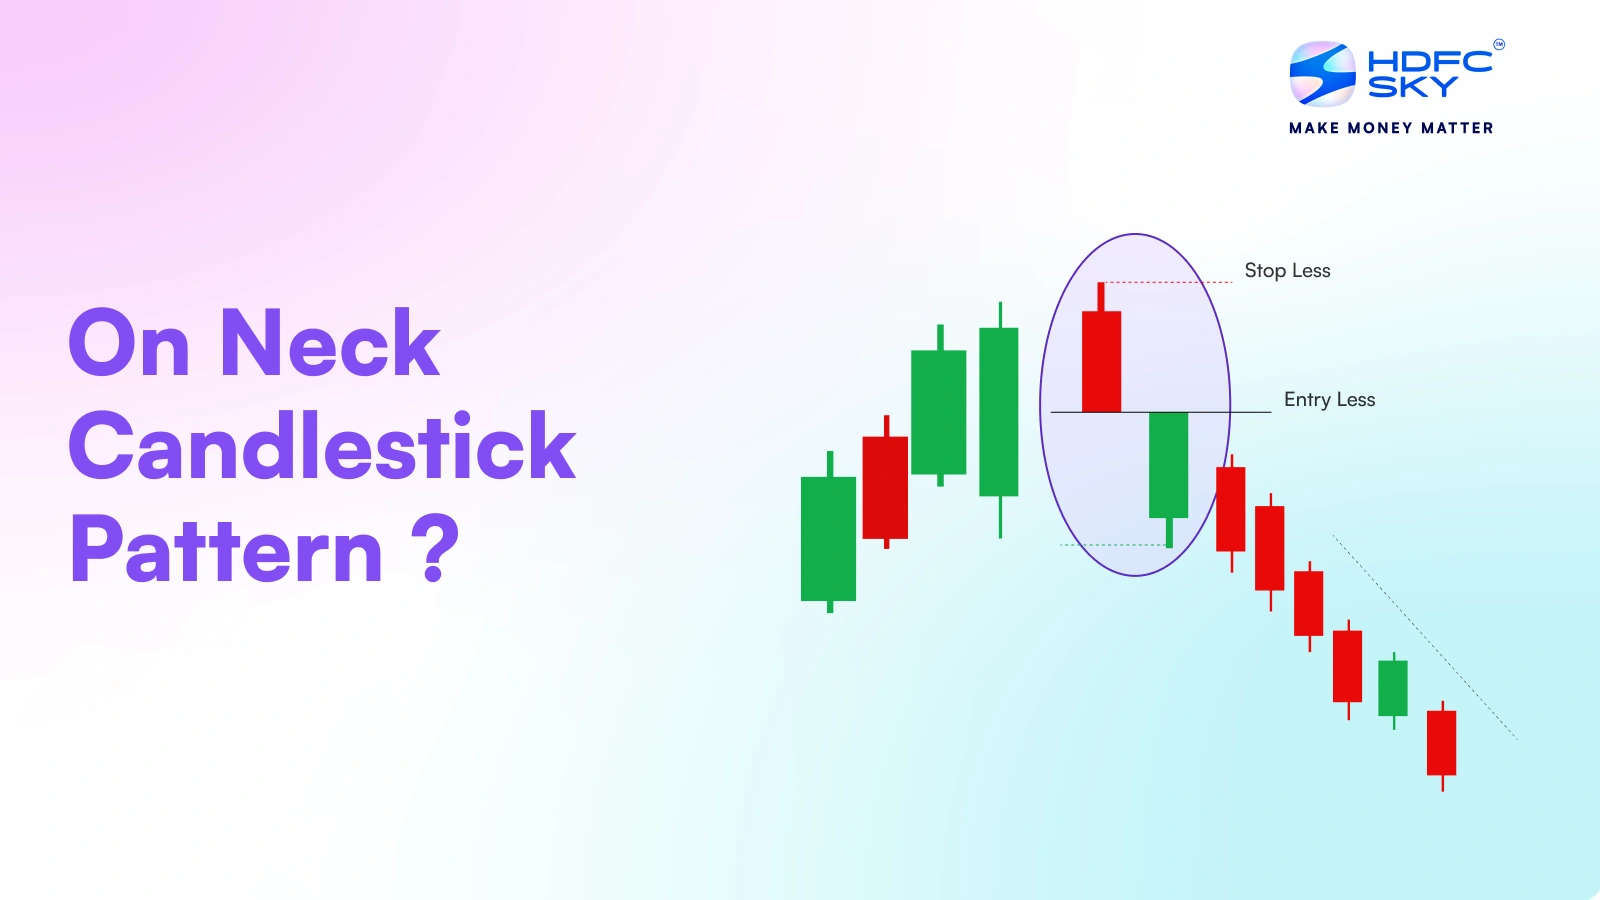
In the on-neck candlestick pattern, a red candle is followed by a green candle, which closes at or near the low of the previous candle. This pattern appears during a downtrend and may indicate continuation of the downtrend. The on-neck candlestick pattern comes from Japanese candlestick formations, and traders often use this to balance their trades as its inception point. It is primarily a continuation pattern instead of a reversal pattern, and it usually emerges when the markets are bearish.
The formation contains a long bearish candle and a short bullish candle, which closes at or near the low of the previous candle.
What is On-Neck Candlestick Pattern?
An on-neck candlestick pattern indicates continuation of a downtrend. The fact that the second green candle closes near the low of the previous red candle indicates that the buying pressure that was built up was ultimately controlled by selling pressure. This in turn indicates to continuation of the downtrend.
How to Identify the On-Neck Pattern?
Now, as you already know what is an on-neck pattern, it’s time to identify the angle of the neckline in an on-neck candlestick pattern. Well, a big bearish candle must precede a smaller bullish candle whose closing price is near the low of the bearish candle.
Some scanners locate the on-neck candlestick pattern scanner automatically. The major identifying points are:
- The first candle demonstrates selling pressure, so it is a bearish candle.
- A second bullish candle is formed but does not break the previous candle’s low.
- The ongoing trend is downwards.
- The second candle has little to no wicks, showing the buyers are weak.
Adapting to this specific pattern allows traders to be certain that the continuation of selling will assist them.
How Does the On-Neck Pattern Work? Explained with an Example
The on-neck pattern works in a way that buyers are in the market, but only for a short period before being overpowered by sellers. Assume a scenario where an asset is in a constant downtrend, followed by a bearish candlestick.
After that, a small bullish candle closes almost near the low of the candle that preceded it. This neckline pattern in trading means that the price is starting to recover, but in reality, there has already been a price drop, and it looks to drop further.
Traders consider many other factors, such as volume and other indicators, before executing a trade. Being adept at identifying on-neck candlestick patterns, both bullish on-neck candlestick pattern and bearish on-neck candlestick pattern, enables traders to develop their tactics and manage risks accordingly.
How to Understand On-Neck Candlestick Patterns?
To understand the on-neck candlestick pattern and how to read it, one must know that indicates continuation of the downtrend. Once this pattern is formed, one would assume that selling pressure should remain strong despite some bullish activity.
In fact, traders should look for volume confirmation or any other bearish indicators to further confirm the indication of bearish trend.
The in-neck pattern is similar to on-neck pattern but in it the closing price of the second candle is slightly above the low price of the previous candle.
The understanding of on-neck and in-neck candlestick patterns helps traders capture market signals in a better way. Since the pattern is biased towards further decline, it can also be combined with momentum indicators.
Limitations of the On-Neck Pattern
The on-neck pattern provides some use in pattern trading but also has limitations. One of the main issues is false signals, as the on-neck pattern can sometimes be invalidated by market conditions, which signal that its bearish continuation is being rejected.
Also, without sufficient volume confirmation, the on-neck pattern can be deceptive regarding trade opportunities. Unlike stronger continuation signals, this pattern is not strong enough to support a trade; therefore, other tools are needed.
As a primary decision-making tool, traders must exercise caution and analyse market conditions first.
On-Neck vs In-Neck Pattern
| Feature | On-Neck Pattern | In-Neck Pattern |
| Trend Context | This shows downtrend | This can also be seen in a downtrend |
| Candle Structure | It begins with a long bearish candle but is followed by a small bullish candle that closes at or below the previous candle’s low. | It begins with a long bearish candle but is followed by a small bullish candle that closes slightly above the previous candle’s low. |
| Market Implication | Confirms the potential continuation of a downtrend. | Indicates to continuation of the downtrend |
| Confirmation Needed | Even after the volume confirmation is achieved, more confirmation will be needed. | Yes, confirmation with other indicators is needed. |
| Trader’s Approach | Used to confirm bearish momentum | Use to confirm bearish momentum |
Both patterns indicate a general bearishness. However, the on-neck pattern suggests a greater likelihood of continuing the downtrend than the in-neck candlestick pattern, which has the possibility of signalling the price to consolidate briefly before moving further.
Conclusion
The on-neck pattern serves traders looking to capture bearish continuation signals. From the first view, this pattern may seem like a potential reversal, but more often, it reaffirms that the downward move is still intact.
Volume analysis and other additional indicators make trading more accurate when using this pattern. It should form part of a broader strategy, taking into account risk management measures to limit possible losses. Also, having an on-neck pattern screener allows every trader to fine-tune their market entries and exits.
Related Articles
FAQs on On-Neck Candlestick Pattern
In which market trend does the on-neck pattern typically occur?
The on-neck candlestick pattern typically occurs during a downtrend.
What is the role of volume in confirming the on-neck candlestick pattern?
Increased trading activity during the time of the bearish candle serves to strengthen the signal and provide confirmation of the above-average selling pressure and continuation of the downtrend.
What other indicators may be used along with the on-neck candlestick pattern?
Yes, alongside the on-neck pattern, traders typically confirm trend directions using indicators like RSI, MACD, and moving averages.
How do on-neck pattern and counterattack lines differ?
Counterattack lines are red flags for trend reversals, while on-neck pattern indicates continuation of the trend.
How do on-neck candlestick patterns help improve risk management?
Once the pattern is established, traders are informed of the continuation of the downtrend, allowing them to set a stop-loss at an optimal point.
How different is an on-neck pattern from a thrusting pattern?
A thrusting pattern has bullish candles that closes above or within the previous candle, while an on-neck pattern has a second candle that close at or near the low of the previous candle.
How do on-neck candlestick patterns work psychologically?
The on-neck candlestick pattern exhibits a temporary shift in buying enthusiasm that fades away sooner than later, resulting in a stronger position for the sellers.

