- Offerings
- Tools & Platforms
Tools & Calculators
- Open API
- Calculators
- SIP Calculator
- CAGR Calculator
- Compound Interest Calculator
- FD Calculator
- RD Calculator
- EPF Calculator
- Retirement Calculator
- HDFC SIP Calculator
- Mutual Fund Return Calculator
- Lumpsum Calculator
- Step Up SIP Calculator
- ETF SIP Calculator
- Brokerage Calculator
- Equity Margin Calculator
- SWP Calculator
- EMI Calculator
- MTF Calculator
- Pricing
- SKY Learn
- Mutual Funds
- Margin Trading
- Financial Planning
- Personal Finance
- Share Trading
- IPO
- Derivatives
- Currencies
- Intraday Trading
- Trading Strategies
- Demat Account
- Commodity
- ETF
Other charting tools: Heikin Ashi, Renko, point and figure
By HDFC SKY | Updated at: Apr 24, 2025 05:01 PM IST
Summary
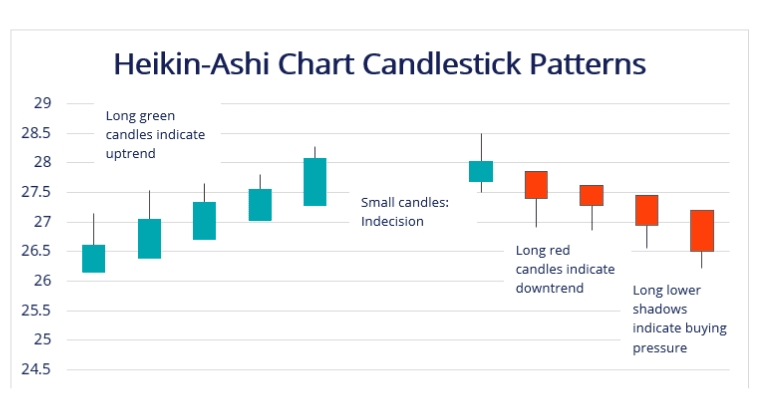
Heikin Ashi chart
Another commonly used price chart is the Heikin Ashi chart. This candlestick pattern technique was developed in the 1700s by Munehisa Homma. In Japanese, Heikin means “average”, while Ashi means “pace”. Thus, Heikin Ashi charts represent the average pace of prices.
Heikin Ashi charts are quite similar to the normal candlestick charts, but the values used to create the candles in Heikin Ashi charts differ from the normal candlestick charts.
Heikin Ashi candlesticks use the open and close data from the previous period and open-high-low-close data from the current period to create a combo candlestick.
This technique is used to filter out some of the market noise as it averages the price data to create a candlestick. It highlights the trend direction in a better way than the standard candlestick charts.
A Heikin Ashi chart uses a modified formula that is based on two-period averages rather than the open, high, low and close like a normal candlestick chart. This technique makes candlestick charts more readable and the trends become easier to analyse.
Traders can use the Heikin Ashi technique in combination with candlestick charts to identify the market trend and predict the prices. They can understand when to stay in or get out of trade, depending on the changes in trend.
Formula:
Close = 1/4 (Open + High + Low + Close)
(The average price of the current bar)
Open = 1/2 (Open of the Previous Bar + Close of the Previous Bar)
(The midpoint of the previous bar)
High = Max(High, Open, Close)
Low = Min(High, Open, Close)
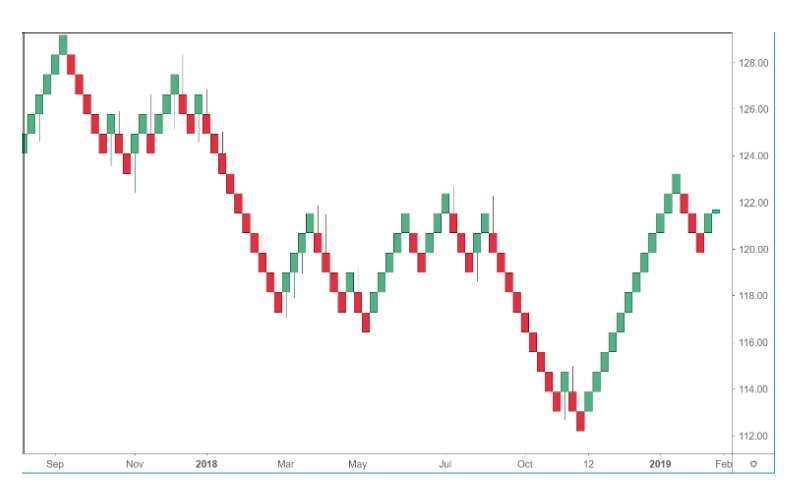
The current candle on a Heikin Ashi chart is calculated using the information from the previous candle, and hence, there are no gaps on these charts. Thus, Heikin Ashi charts have more consecutive coloured candles as compared to the normal candlestick charts where the colour of the candles change frequently. This makes Heikin Ashi easier to read and identify the trends.
What Does Heikin Ashi indicate?
Traders can spot the current trend more easily through the Heikin Ashi technique. Hollow white or green candles signal a strong uptrend. Whereas, filled black or red candles with no upper shadow signal a strong downtrend.
Reversal candlesticks in the Heikin Ashi charts have small bodies and long upper or lower shadows, similar to the traditional candlestick reversal patterns.
In a sideways to choppy markets, the Heikin Ashi technique reduces false trading signals, helping traders to avoid placing trades during such times.
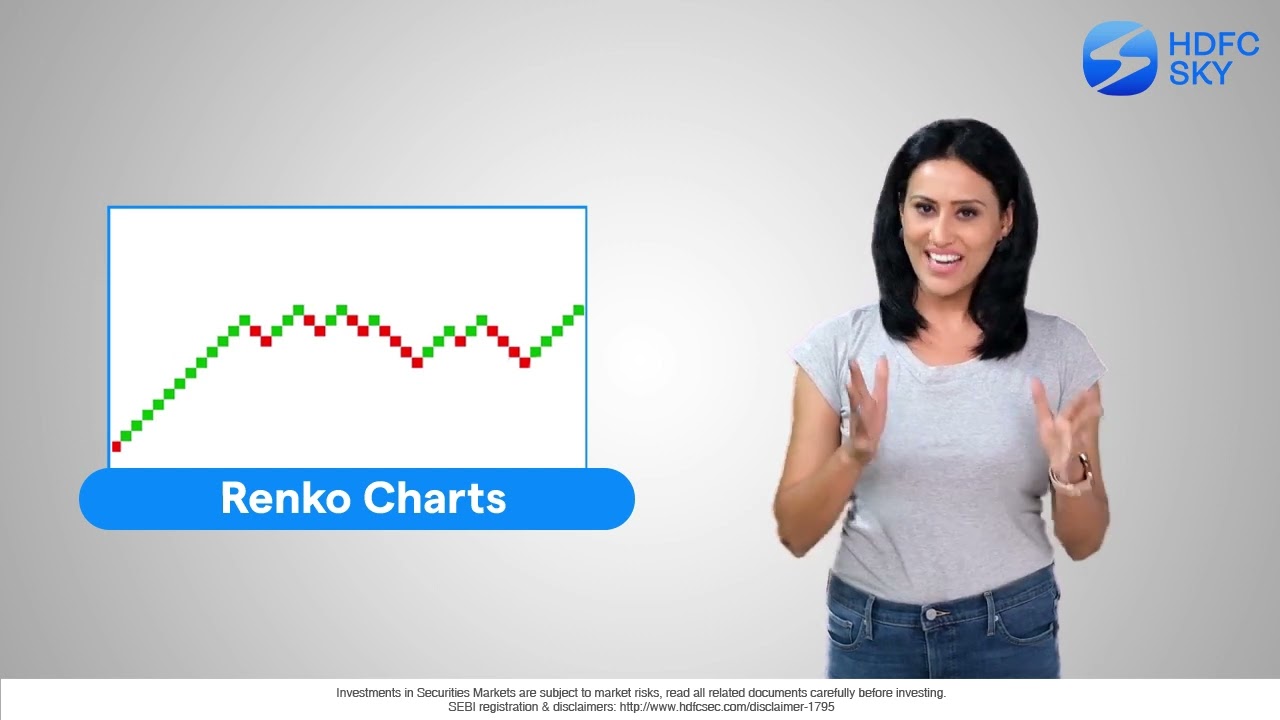
Renko charts
Renco charts are a type of trading charts that are built by using price movements rather than both price and standardised time intervals. This chart looks like a series of bricks.
The stock price must move a specified amount to create a Renco brick. The trader determines the size of the brick for the chart. This determines when the new brick will be formed. These bricks are never directly beside one another.
A new brick is created only when the price moves by a specified price amount. Each brick is positioned at a 45-degree angle, up or down, to the prior brick.
The Renko bricks are white or green when the price is rising. When the stock price is falling, the Renko bricks are black or red. Renko chart helps to easily spot the current direction in which the stock price is moving. These charts filter out small price movements, helping traders to focus on the larger trend.
For example, let us assume for a stock chart, a trader chooses the brick size of 50. This means that the stock price needs to move 50 points from the closing price of the previous brick to form a new brick in the current direction. Here, the bricks will highlight only moves of 50 points. Price movements smaller than 50 points from the previous brick will not form a new brick. As the bricks cannot form beside each other, the price needs to move by 100 points to form a brick in the opposite direction.
In a Renko chart, a brick could take a long time to form, sometimes even months, while some bricks can form within a day. Increasing the reducing the box size will affect the smoothness of the chart. Smaller box size will create more swings but can highlight the possible price reversal earlier. On the other hand, a larger box size will decrease noise and the number of swings will also be lower, but it will also be slower to signal any price reversal.
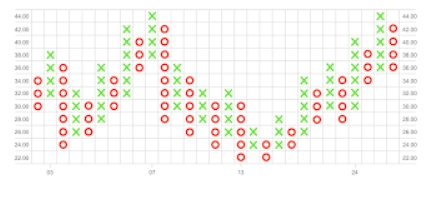
Point & Figure chart
The Point & Figure (P&F) charts are made up of multiple columns of Xs and Os that represent a set quantum of price movements. X-columns illustrate rising prices, while O-columns represent falling prices.
In these charts, the column of Xs is always followed by a column of Os, and vice-versa. The chart is made up of multiple boxes and each box is equal to a certain price level. If the price increases to that level, the box is filled with an X and if the price decreases to that level, the box gets filled with an O.
These charts evolve as prices move, while time is not a factor on these charts. Here, small price movements are filtered out, and these charts are less susceptible to false breakouts. The new information is plotted on a P&F chart only if there is price action. The chart remains unaltered if the price does not change even for a long time.
The most used P&F charting method is the 3-box reversal method. In this chart, column reversals and starting a new one in an opposite direction require a minimum of three boxes to be filled (with either three Xs or three Os).
The support and resistance levels are easily identified with the help of P&F charts. These charts provide automatic and subjective trendlines.
Related Articles

