- Offerings
- Tools & Platforms
Tools & Calculators
- Open API
- Calculators
- SIP Calculator
- CAGR Calculator
- Compound Interest Calculator
- FD Calculator
- RD Calculator
- EPF Calculator
- Retirement Calculator
- HDFC SIP Calculator
- Mutual Fund Return Calculator
- Lumpsum Calculator
- Step Up SIP Calculator
- ETF SIP Calculator
- Brokerage Calculator
- Equity Margin Calculator
- SWP Calculator
- EMI Calculator
- MTF Calculator
- Pricing
- SKY Learn
- Mutual Funds
- Margin Trading
- Financial Planning
- Personal Finance
- Share Trading
- IPO
- Derivatives
- Currencies
- Intraday Trading
- Trading Strategies
- Demat Account
- Commodity
- ETF
- What is Paper Umbrella Candlestick?
- Features of Paper Umbrella Candlestick Pattern
- Types of Paper Umbrella Candlestick Patterns
- Breaking Down the Hammer Formation
- Hanging Man Formation in the Paper Umbrella Candlestick Pattern
- Breaking Down the Hanging Man Formation
- Making Use of Candlestick Paper Patterns
- Conclusion
- FAQs on What is Paper Umbrella Candlestick Pattern?
Paper Umbrella Candlestick Pattern
By HDFC SKY | Updated at: Jul 24, 2025 06:26 PM IST
- Topic Focus: The article explores the Paper Umbrella candlestick pattern, which encompasses both the Hammer and Hanging Man formations in technical analysis.
- Definition: A Paper Umbrella is a single candlestick pattern with a small body near the top and a long lower shadow, indicating price rejection at lower levels.
- Key Variants:
- Hammer: Appears at the bottom of a downtrend; signals a potential bullish reversal.
- Hanging Man: Forms at the top of an uptrend, suggesting a bearish reversal might occur.
- Market Implication: The long lower shadow implies buyers stepping in after a period of selling pressure, which is crucial for identifying trend reversals.
- Trading Strategy:
- Best confirmed with volume analysis or other indicators like RSI or support/resistance zones.
- Caution: Reversal not guaranteed—needs confirmation in next sessions before taking positions.
- Use Case: Helpful for intraday, swing, and positional trading strategies across equity, commodity, and forex markets.
- Investor Insight: This pattern aids traders in spotting entry/exit points by analyzing market sentiment shifts at critical price zones.
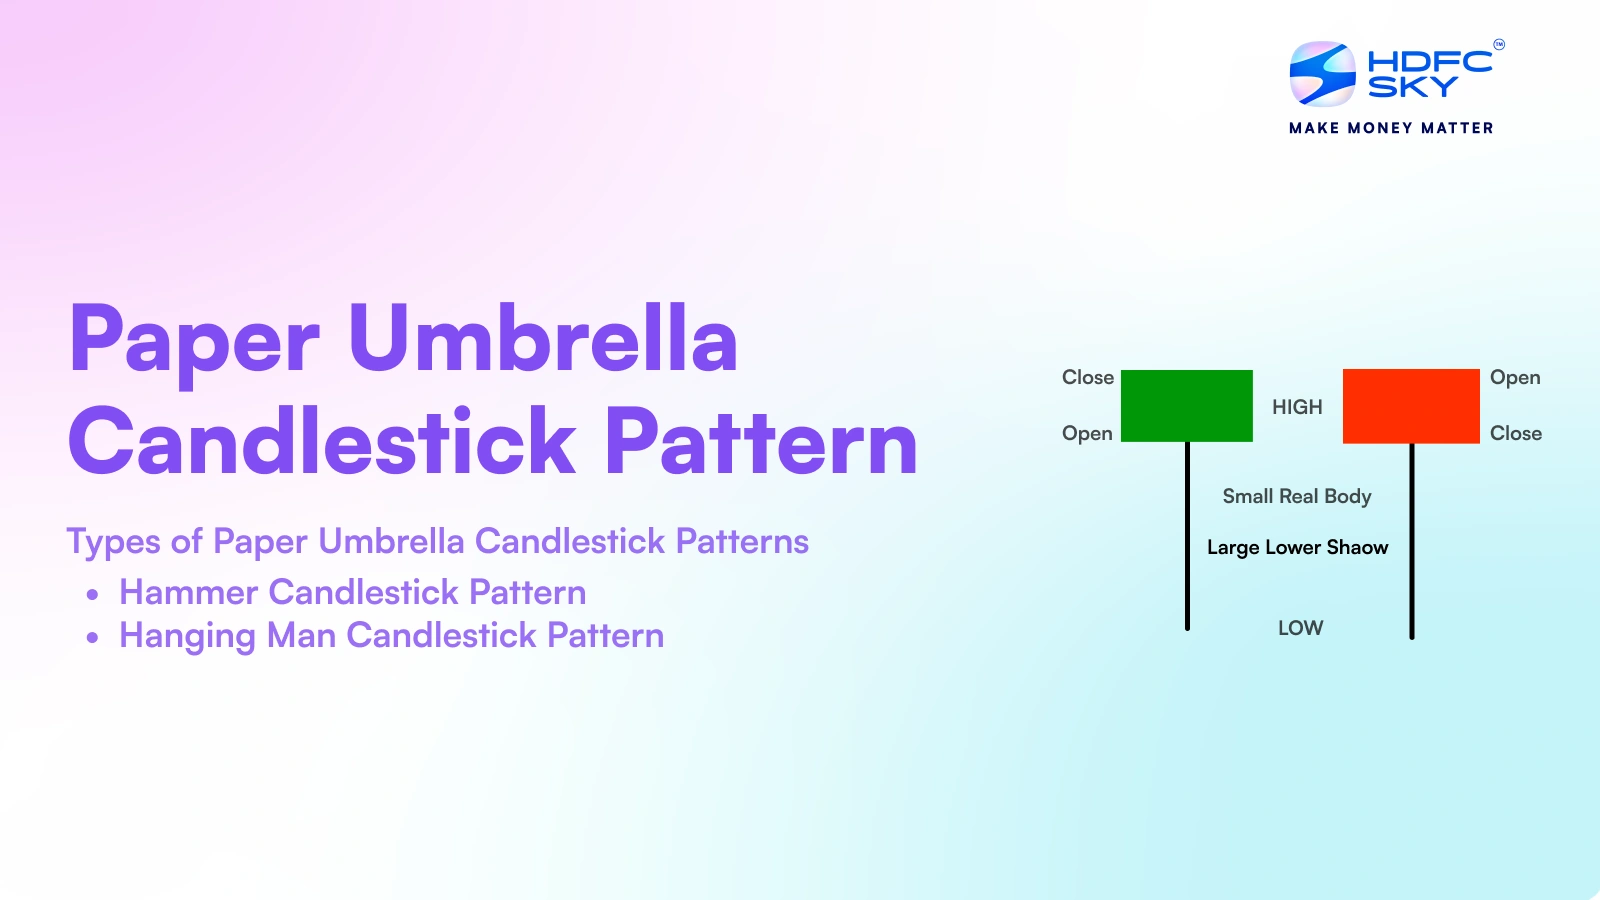
A paper umbrella candlestick is a popular candlestick pattern studied in technical analysis. It is mostly considered a key to strong trend reversals. A paper umbrella candlestick pattern is a single candlestick pattern. In this, the length of the lower shadow is at least twice the length of the body of the candlestick. If such a candlestick appears at the bottom of a downward rally, it indicates probable trend reversal to bullish (this is known as hammer paper umbrella). If such a candlestick appears at the top of an upward rally then it indicates a probable trend reversal to bearish (this is known as hanging man paper umbrella).
What is Paper Umbrella Candlestick?
A paper umbrella candlestick pattern is a candlestick pattern found in markets that may be in the phase of a directional change in the prevailing trend.
The paper umbrella is one of the most helpful candlestick patterns in umbrella pattern trading. It helps traders identify breakouts and time their trades correctly. The paper umbrella is helpful in stock markets, forex, and crypto trading as a tool for determining when to trade to maximise profits while minimising losses.
Features of Paper Umbrella Candlestick Pattern
The key features of paper umbrella candlestick pattern are as follows:
- Trends: Assists traders in discerning trends for entry or exit.
- Lower Shadow: A long lower shadow that is at least twice the length of the body of the candle.
- Smaller Body: The length of the body is the difference between the opening and closing prices..
- No Upper Shadow: There is no upper shadow in this pattern.
These features of the paper umbrella candlestick pattern indicates that a strong reversal is on the way in the underlying security, which can be a stock, forex, commodity, etc.
Types of Paper Umbrella Candlestick Patterns
There are two significant classifications of umbrella patterns in candlestick charts:
1. Hammer Candlestick Pattern
It indicates reversal from a bearish trend to a bullish one if it appears at the bottom of a descending trend, with a smaller body and a longer lower shadow. The sellers lower the prices, but the buyers eventually take over. Traders interpret this as a warning of a possible price decline and trend reversal.
2. Hanging Man Candlestick Pattern
It indicates reversal to a bearish trend if it appears at the top of an upward rally. This candle, with its smaller body and longer lower shadow, shows that the price is likely to decline. A trend reversal is expected as the sellers have begun to outpower the buyers.
Breaking Down the Hammer Formation
The hammer formation is a key candlestick charting pattern that indicates a bullish reversal. It comprises a tiny real body located towards the top of the candlestick, with a long lower shadow that extends at least double the real body’s size.
The absence of an upper shadow indicates buyers took charge of the market after the initial selling had exhausted. This formation usually happens at the end of a downtrend, suggesting a turning point in the market where buyers start dominating and raising prices.
Hanging Man Formation in the Paper Umbrella Candlestick Pattern
The hanging man candlestick pattern happens after an uptrend, showing the likelihood of selling pressure in the market. For the same reasons it is comparable to a hammer, its position tells us it is bearish.
Breaking Down the Hanging Man Formation
At the peak of an uptrend, the hanging man formation is a bearish reversal candlestick pattern. It has a very small real body, and long shadow indicate initial selling pressure and the presence of strong bears in the market.
The lack of an upper shadow means buyers failed to push and take the price higher. This pattern should be seen as a warning sign of an impending downtrend. This states that control will soon shift to sellers, allowing for a possible fall in prices if subsequent down bearish candles confirm them.
Making Use of Candlestick Paper Patterns
To take advantage of the paper umbrella patterns, traders have to:
1. Confirmation of Reversals:
Seek the next candle to confirm the trend change identified. The candle following is either a strong bullish or bearish candle sufficient to confirm the change in trend. Wait for clear signals before making trading decisions.
2. Stop-Loss Placement:
Apply for stop loss orders to lessen the chances of incurred losses. It helps to cushion the trader from unfounded market signals while at the same time offering a defined approach to risk management. The stop loss operates as a cushioning factor during frantic market activities.
3. Entry and Exit Points:
Use the identified candlestick pattern to determine the best moments to enter and exit trades in the defined trend. The umbrella pattern acts as an important technical tool for determining whether a market needs to be entered or potentially reversed. Ensure that the entry points are considerably in line with the market direction.
4. Confirmation with Indicators:
Pattern reliability can be improved when combined with technical indicators like RSI, MACD, or even moving averages. The more confirmations there are, the more accurate the trend prediction will likely be. A multi-indicator approach increases prediction accuracy and decreases the chances of fake signals.
Conclusion
Finding the paper umbrella candlestick pattern is significant for traders looking for trend reversals. In each instance where the hanging man candlestick pattern is used for bearish signals, and the hammer candlestick is for bullish ones, comprehension of these formations can assist people doing trades. If confirmed with other indicators, these patterns offer valuable information about movements in the market.
Related Articles
FAQs on What is Paper Umbrella Candlestick Pattern?
In what market conditions does the Paper Umbrella pattern typically appear?
The paper umbrella candlestick is mainly used during a change in trends, signifying a potential upward or downward movement from the previous candlestick.
What is the difference between a shooting star and a paper umbrella?
A shooting star has a minor body with a long top shadow, whereas, in the paper umbrella candle, the long shadow is on the bottom and appears in a different market context.
How can I identify the Paper Umbrella candlestick pattern on a price chart?
Search for a candlestick with a small body, a long lower shadow, and little to no upper shadow at the end of a trend.
What does a Paper Umbrella pattern signify when found in a downtrend?
It signifies the possibility of a bullish reversal, indicating that buyers stepped in to support the price.
Should the Paper Umbrella pattern be confirmed with other technical indicators?
Indeed, confirming using the RSI, MACD, or moving averages would mitigate the chances of making false trades with the umbrella candlestick pattern.
What does a Paper Umbrella pattern signify when found in a downtrend?
It signifies the possibility of a bullish reversal, indicating that buyers stepped in to support the price.
How does market sentiment influence the effectiveness of the Paper Umbrella pattern?
The hammer formation becomes more reliable with stronger buyer sentiment, and the hanging man candlestick formation depends on bearish sentiment.
Can the Paper Umbrella pattern be integrated into automated trading strategies?
Specific trading systems include umbrella line candlestick patterns for trading signals, often in conjunction with various other indicators and techniques to achieve better results.

