- Offerings
- Tools & Platforms
Tools & Calculators
- Open API
- Calculators
- SIP Calculator
- CAGR Calculator
- Compound Interest Calculator
- FD Calculator
- RD Calculator
- EPF Calculator
- Retirement Calculator
- HDFC SIP Calculator
- Mutual Fund Return Calculator
- Lumpsum Calculator
- Step Up SIP Calculator
- ETF SIP Calculator
- Brokerage Calculator
- Equity Margin Calculator
- SWP Calculator
- EMI Calculator
- MTF Calculator
- Pricing
- SKY Learn
- Mutual Funds
- Margin Trading
- Financial Planning
- Personal Finance
- Share Trading
- IPO
- Derivatives
- Currencies
- Intraday Trading
- Trading Strategies
- Demat Account
- Commodity
- ETF
- What is RSI in Stock Market
- How to Calculate Relative Strength Index (RSI)
- How Does the Relative Strength Index (RSI) Work?
- How to Use Relative Strength Index (RSI)?
- What Does RSI Indicate About Market Momentum?
- What is RSI Divergence?
- What is RSI Convergence?
- Failure Swings
- Importance of RSI Indicator
- Benefits of Relative Strength Index (RSI)
- Limitations of Relative Strength Index (RSI)
- Conclusion
- FAQs
What is Relative Strength Index & How Does the Relative Strength Index (RSI) Work?
By HDFC SKY | Updated at: Oct 13, 2025 10:42 AM IST
Relative Strength Index (RSI) is a popular technical indicator used by traders to evaluate the momentum of a stock or asset. The RSI full form is Relative Strength Index and it measures the speed and change of price movements. Typically ranging from 0 to 100 RSI helps identify overbought or oversold conditions in the market guiding traders in making better entry and exit decisions.
What is RSI in Stock Market
RSI meaning in the stock market refers to the Relative Strength Index, a momentum oscillator that measures the speed and magnitude of recent price changes. It helps traders determine whether a stock is overbought or oversold typically on a scale of 0 to 100. An RSI above 70 indicates overbought conditions, while below 30 suggests oversold levels.
RSI Formula (Relative Strength Index): RSI = 100 – [100 / (1 + RS)]
Where:
RS (Relative Strength) = Average Gain over a period / Average Loss over the same period
The default period is usually 14 days
This formula helps assess momentum by comparing the magnitude of recent gains to recent losses.
How to Calculate Relative Strength Index (RSI)
The RSI measures the speed and change of price movements to identify overbought or oversold conditions. It uses average gains and losses over a set period.
- Select the time period: Typically 14 days.
- Calculate daily price changes: Note each gain and loss.
- Compute average gain and average loss over 14 days.
- Calculate RS (Relative Strength): RS = Average Gain / Average Loss
- Apply RSI formula: RSI = 100 – [100 / (1 + RS)]
The RSI value ranges from 0 to 100 and helps identify overbought (above 70) or oversold (below 30) market conditions.
How Does the Relative Strength Index (RSI) Work?
The RSI works by measuring the momentum of price movements to identify potential trend reversals or continuations.
- RSI compares recent gains and losses to determine if an asset is overbought or oversold.
- It generates a value between 0 to 100.
- Above 70: Indicates overbought conditions possible price correction or pullback.
- Below 30: Indicates oversold conditions potential upward reversal.
- Traders use RSI with other indicators to confirm signals and reduce false alerts.
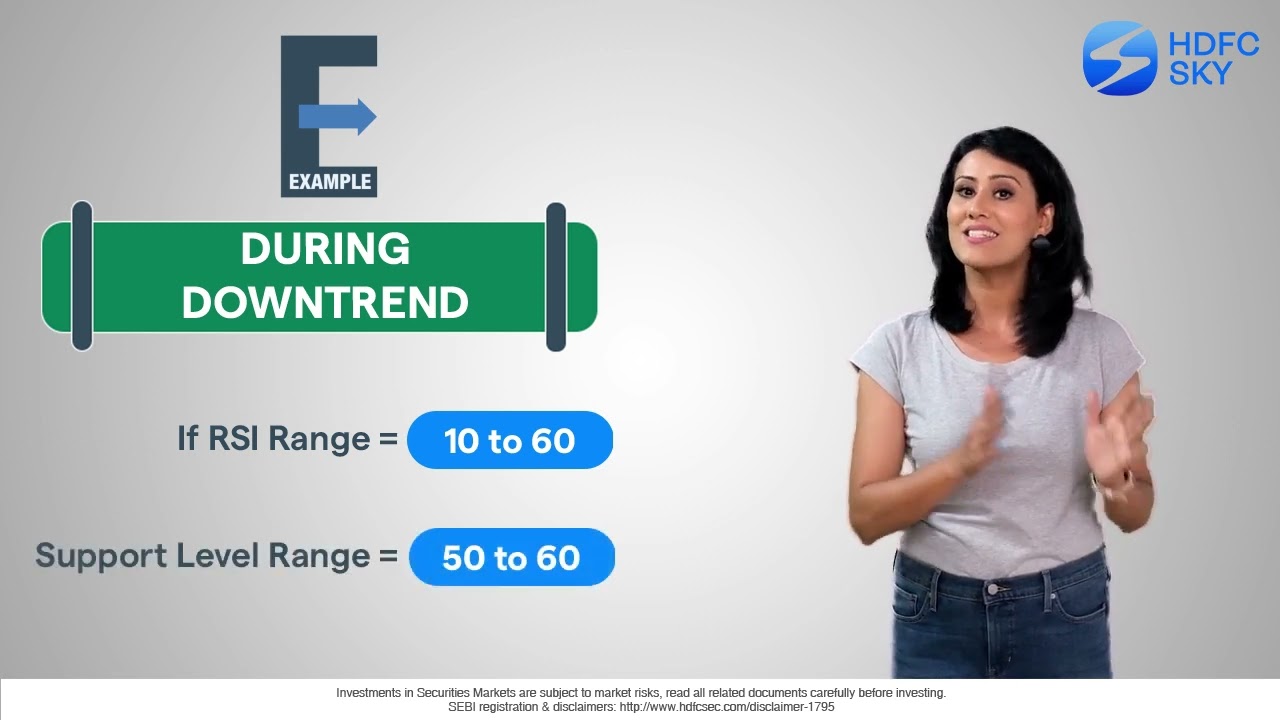
How to Use Relative Strength Index (RSI)?
What Does RSI Indicate About Market Momentum?
RSI indicates the strength and direction of a stock’s price momentum. It ranges from 0 to 100 and helps identify potential trend reversals.
- RSI above 70: Typically signals that the stock is overbought, suggesting a possible price correction or reversal.
- RSI below 30: Indicates that the stock is oversold, hinting at a potential upward reversal.
- Neutral zone (30–70): Suggests stable momentum without extreme price pressure.
- Divergence signals: If the price makes a new high/low but RSI doesn’t, it may indicate a weakening trend.
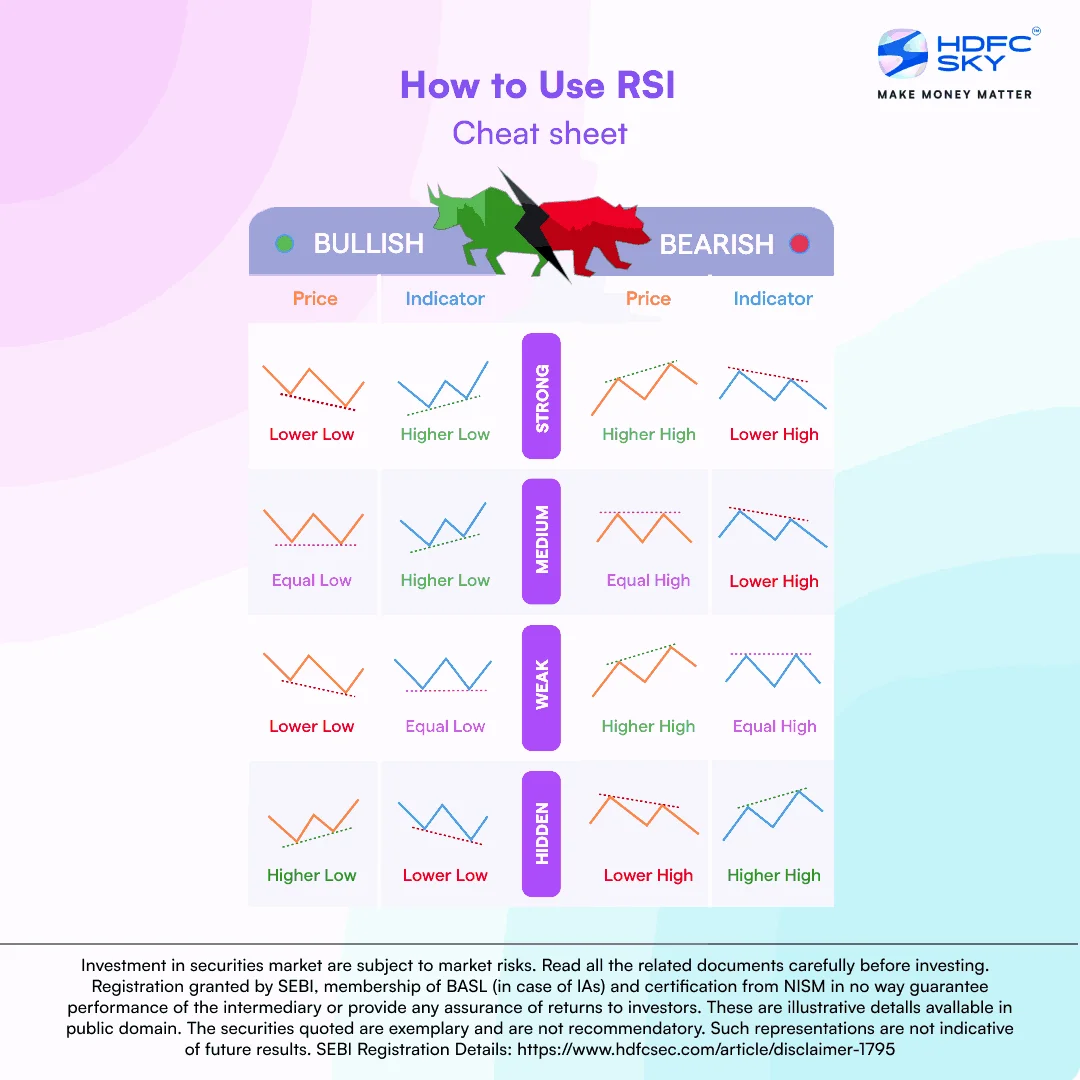
What is RSI Divergence?
Divergences signal a potential reversal point as directional momentum does not confirm the price. When an underlying stock makes a lower low and the RSI forms a higher low, a bullish divergence occurs. RSI does not confirm the lower low and this shows strengthening momentum
A bearish divergence is formed when the stock price makes a higher high and the RSI indicator forms a lower high. RSI does not confirm the new high and this shows weakening momentum
What is RSI Convergence?
RSI Convergence occurs when the Relative Strength Index (RSI) moves in the same direction as the price trend, confirming the strength of that trend. It indicates that momentum supports the current price movement, suggesting the trend is likely to continue.
Failure Swings
Failure swings are also considered strong indications of an impending reversal. Failure swings are independent of price action, focusing solely on RSI for signals and ignoring the concept of divergences
When RSI moves below 30(oversold) and bounces above 30,pulls back, holds above 30 and then breaks its previous high a bullish failure swing is formed. It is a move to oversold levels and then a higher low above the oversold levels. A bearish failure swing forms when RSI moves above 70, pulls back, bounces, fails to exceed 70 and then breaks its prior low
Importance of RSI Indicator
The RSI indicator helps traders identify market momentum and potential reversal points by showing overbought or oversold conditions. It is a key tool for making informed trading decisions.
- Helps spot trend strength and momentum shifts
- Indicates overbought (potential sell) and oversold (potential buy) levels
- Assists in timing entry and exit points effectively
- Works across various timeframes and markets
- Enhances risk management by signaling possible reversals
- Can be combined with other indicators for better accuracy
Benefits of Relative Strength Index (RSI)
The Relative Strength Index (RSI) is a powerful momentum indicator that helps traders identify potential overbought or oversold conditions in the market. It assists in making informed decisions by highlighting possible trend reversals.
- Identifies Overbought and Oversold Conditions: Helps traders spot when a stock may be due for a reversal.
- Measures Market Momentum: Shows the strength and speed of price movements.
- Easy to Use: Simple scale from 0 to 100 makes interpretation straightforward.
- Versatile: Applicable across different markets and timeframes.
- Supports Timing Trades: Helps decide optimal entry and exit points.
- Helps Avoid False Signals: When combined with other indicators, improves decision-making accuracy.
Limitations of Relative Strength Index (RSI)
The Relative Strength Index (RSI) is a popular momentum indicator but it has its drawbacks that traders should be aware of:
- False Signals: RSI can sometimes give false overbought or oversold signals during strong trends, leading to premature entries or exits.
- Lagging Indicator: Like most technical tools, RSI is based on past price data, so it may lag behind actual market movements.
- Doesn’t Account for Volume: RSI only considers price changes and ignores volume, which can be crucial for confirming trend strength.
- Sensitivity to Parameter Settings: Different RSI periods can produce varying results, requiring careful adjustment for each market or asset.
- Less Effective in Sideways Markets: RSI may generate choppy signals when the market is ranging without a clear trend.
Traders should combine RSI with other indicators and analysis methods to improve accuracy.
Conclusion
The Relative Strength Index (RSI) is a reliable and widely used tool for measuring market momentum and identifying overbought or oversold conditions. It helps traders understand the strength and direction of price movements, making it easier to spot potential reversals or continuation signals. However since RSI can produce false signals during strong trends or sideways markets, it should not be used in isolation. Combining RSI with other technical indicators such as moving averages or trendlines can improve accuracy and help traders make well-informed trading decisions.
Related Articles
FAQs
Does RSI 70 mean buy or sell?
An RSI of 70 typically indicates overbought conditions, which may signal a potential sell opportunity.
What Happens When RSI Is High?
A high RSI (above 70) suggests that the asset may be overvalued or overbought, possibly leading to a price correction.
What Is the Difference Between RSI and Moving Average Convergence Divergence (MACD)?
RSI measures price momentum over time, while MACD tracks the relationship between two moving averages to signal trend changes.
Which RSI is bullish?
An RSI rising from below 30 and crossing above 50 often signals bullish momentum.

