- Offerings
- Tools & Platforms
Tools & Calculators
- Open API
- Calculators
- SIP Calculator
- CAGR Calculator
- Compound Interest Calculator
- FD Calculator
- RD Calculator
- EPF Calculator
- Retirement Calculator
- HDFC SIP Calculator
- Mutual Fund Return Calculator
- Lumpsum Calculator
- Step Up SIP Calculator
- ETF SIP Calculator
- Brokerage Calculator
- Equity Margin Calculator
- SWP Calculator
- EMI Calculator
- MTF Calculator
- Pricing
- SKY Learn
- Mutual Funds
- Margin Trading
- Financial Planning
- Personal Finance
- Share Trading
- IPO
- Derivatives
- Currencies
- Intraday Trading
- Trading Strategies
- Demat Account
- Commodity
- ETF
Saatvik Green Energy IPO
₹14,144/32 shares
Minimum Investment
IPO Details
19 Sep 25
23 Sep 25
₹14,144
32
₹442 to ₹465
NSE, BSE
₹900 Cr
26 Sep 25
Saatvik Green Energy IPO Timeline
Bidding Start
19 Sep 25
Bidding Ends
23 Sep 25
Allotment Finalisation
24 Sep 25
Refund Initiation
25 Sep 25
Demat Transfer
25 Sep 25
Listing
26 Sep 25
Saatvik Green Energy Limited
Saatvik Solar is a prominent Indian solar module manufacturer known for innovation, quality, and sustainability. Operating from a cutting-edge facility in Ambala, Haryana, with a 3.8GW annual production capacity, the company delivers advanced solar solutions to Indian and global markets.Its product portfolio includes high-performance modules tailored to diverse needs. The Monofacial (G2WB) modules offer efficiency and sleek designs, ideal for residential and commercial applications. The Bifacial (G2TB) modules maximise energy output by capturing sunlight on both sides, while N-TopCon Modules ensure superior durability and performance for long-term energy demands.
Saatvik Green Energy Limited IPO Overview
Saatvik Green Energy IPO is a book build issue worth ₹900.00 crores, consisting of a fresh issue of 1.51 crore shares aggregating to ₹700.00 crores and an offer for sale of 0.43 crore shares amounting to ₹200.00 crores. The IPO will open for subscription on September 19, 2025, and close on September 23, 2025. The basis of allotment is expected to be finalised on September 24, 2025, with the shares proposed to list on BSE and NSE on a tentative listing date of September 26, 2025. The price band has been set between ₹442.00 and ₹465.00 per share, with a lot size of 32 shares. For retail investors, the minimum investment required is ₹14,880 (based on the upper price band). For sNII, the lot size is 14 lots (448 shares) amounting to ₹2,08,320, while for bNII, it is 68 lots (2,176 shares) amounting to ₹10,11,840. Dam Capital Advisors Ltd. is serving as the book running lead manager, and Kfin Technologies Ltd. is the registrar of the issue.
Saatvik Green Energy Limited Upcoming IPO Details
| Category | Details |
| Issue Type | Book Built Issue IPO |
| Total Issue Size | Fresh Issue: ₹700 crore |
| Offer for Sale: ₹200 crore | |
| IPO Dates | 19 September 2025 to 23 September 2025 |
| Price Bands | ₹442 to ₹465 per share |
| Lot Size | 32 shares |
| Face Value | ₹10 per share |
| Listing Exchange | BSE, NSE |
| Shareholding pre-issue | 11,20,47,000 shares |
| Shareholding post -issue | TBA |
Saatvik Green Energy IPO Lots
| Application | Lots | Shares | Amount |
| Retail (Min) | 1 | 32 | ₹14,880 |
| Retail (Max) | 13 | 416 | ₹1,93,440 |
| S-HNI (Min) | 14 | 448 | ₹2,08,320 |
| S-HNI (Max) | 67 | 2,144 | ₹9,96,960 |
| B-HNI (Min) | 68 | 2,176 | ₹10,11,840 |
Saatvik Green Energy Limited IPO Reservation
| Investor Category | Shares Offered |
| QIB Shares Offered | Not more than 50% of the Offer |
| Retail Shares Offered | Not less than 35% of the Offer |
| NII (HNI) Shares Offered | Not less than 15% of the Offer |
Saatvik Green Energy Limited IPO Valuation Overview
| KPI | Value |
| Earnings Per Share (EPS) | 8.96 |
| Price/Earnings (P/E) Ratio | TBD |
| Return on Net Worth (RoNW) | 83.21% |
| Net Asset Value (NAV) | 10.77 |
| Return on Equity | 83.21% |
| Return on Capital Employed (ROCE) | 64.07% |
| EBITDA Margin | 14.42% |
| PAT Margin | 9.16% |
| Debt to Equity Ratio | 2.18 |
Objectives of the IPO Proceeds
The Net Proceeds are intended to be utilised as per the details provided in the table below:
| Particulars | Amount (in ₹ million) |
| Investment i wholly owned Subsidiary, Saatvik Solar Industries Private Limited, in the form of debt or equity for repayment/prepayment of borrowings, in full or in part, of all or a portion of certain outstanding borrowings availed by such Subsidiary | 1664.4 |
| Investment in our wholly owned Subsidiary, Saatvik Solar Industries Private Limited, for`setting up of a 4 GW solar PV module manufacturing facility at National Highway –16, Chamakhandi, Gopalpur Industrial Park, Gopalpur, Ganjam | 4772.3 |
| Prepayment or scheduled repayment of a portion of certain outstanding borrowings | 108.2 |
| General corporate purposes* | [●] |
Note: *To be determined upon finalisation of the Offer Price and updated in the Prospectus prior to filing with the RoC
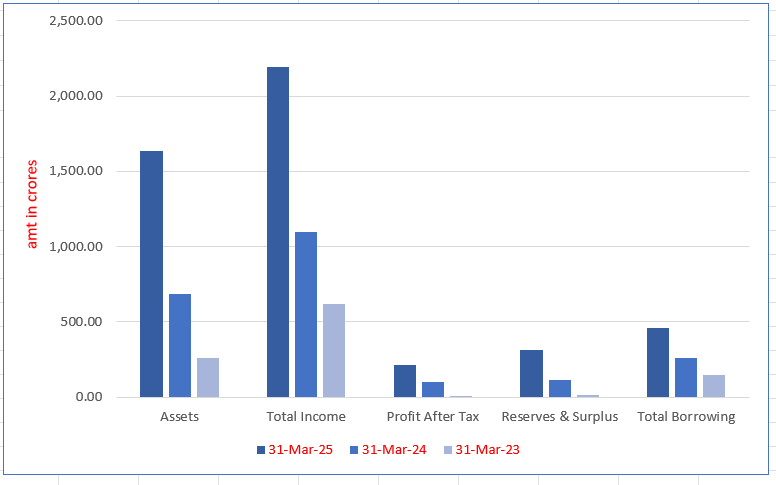
Saatvik Green Energy Limited Financials ( (in millions)
| Period Ended | 31 Mar 2025 | 31 Mar 2024 | 31 Mar 2023 |
| Assets | 1,635.74 | 688.04 | 263.00 |
| Total Income | 2,192.47 | 1,097.18 | 617.63 |
| Profit After Tax | 213.93 | 100.47 | 4.75 |
| Reserves & Surplus | 315.25 | 117.36 | 16.89 |
| Total Borrowing | 458.10 | 263.42 | 144.49 |
Financial Status of Saatvik Green Energy Limited
SWOT Analysis of Saatvik Green Energy IPO
Strength and Opportunities
- Leading solar module manufacturer in India with a strong market share and reputation for quality and innovation.
- Advanced manufacturing facility with an impressive production capacity of 3.8 GW annually, supporting large-scale demand.
- Diverse product portfolio catering to residential, commercial, and industrial energy needs, ensuring versatility in offerings.
- Strong revenue growth in recent years, demonstrating robust market demand for its products and services.
- Plans to expand production capacity, meeting the growing demand for solar energy solutions globally.
- Actively seeking ₹1,000 crore in private equity funding to support growth and expansion initiatives.
- Positioned to benefit from India's renewable energy push and government policies promoting clean energy solutions.
- Opportunities to explore the growing global market for solar energy and expand its international presence.
- Potential to diversify into related renewable energy sectors, such as energy storage and hybrid energy solutions, increasing market reach.
- Economies of scale enable cost reductions in production, enhancing competitiveness and profitability in the market.
- Collaborations with international partners offer access to advanced technologies and new market opportunities.
Risks and Threats
- Faces intense competition from domestic and international solar module manufacturers, impacting market share and pricing strategies.
- High debt levels could affect financial stability and limit the company’s ability to invest in future projects.
- Vulnerable to raw material price fluctuations, impacting production costs and profit margins significantly.
- Regulatory changes in the renewable energy sector could create challenges and increase compliance costs for the company.
- Dependence on government incentives and policies for renewable energy could lead to uncertainties in revenue stability.
- Potential supply chain disruptions could delay production timelines and increase operational costs.
- Exposure to foreign exchange risks due to reliance on imported raw materials and components.
- Rapid technological advancements require continuous investment in research and development to maintain a competitive edge.
- Environmental and climatic factors may impact the efficiency and deployment of solar energy modules.
- Challenges in maintaining consistent product quality and performance during rapid expansion in manufacturing and operations.
- Market volatility and economic downturns could negatively affect investments and consumer demand in the renewable energy sector.
Explore IPO Opportunities
Explore our comprehensive IPO pages to stay updated on the latest trends and insights.
All About Saatvik Green Energy Limited IPO
More About Saatvik Green Energy Limited
Saatvik Green Energy Limited is a prominent player in India’s solar energy sector, recognised for its robust manufacturing capabilities and innovative solutions. Below is an insight into its operations, achievements, and offerings.
Solar Module Manufacturing
- Capacity: Operational solar PV module capacity of 1.8 GW as of June 30, 2024.
- Growth: Expanded from 125 MW in FY 2017 to 1.8 GW in FY 2024.
- Technologies Used: Modules manufactured with M10 and N-TopCon technologies, offering mono-facial and bifacial options.
- Certifications: Products meet global standards, including ISO certifications and certifications from UL India and TÜV Rheinland.
Turnkey EPC Services
- Comprehensive Offerings: From engineering and procurement to construction and commissioning.
- Key Projects:
- 61.42 MW floating solar power project in Telangana (2023).
- 72.15 MW module supply for Raghanseda Solar Park, Gujarat (2023).
- Rooftop and ground-mounted installations for leading clients like Jindal Steel and Power Limited.
Customer Base and Market Reach
- Diversified Segments: Catering to utility-scale developers, IPPs, industrial clients, and residential users.
- Geographical Presence: Operations extend across India, North America, Africa, and South Asia.
Financial Achievements
- Revenue Growth: From ₹4,799.50 million in FY 2022 to ₹10,879.65 million in FY 2024.
- Profitability: Operating margin increased to 13.32% in FY 2024, reflecting efficiency improvements.
Leadership Excellence
- Management Team: Led by experienced professionals, including Chairman Neelesh Garg and CEO Prashant Mathur.
- Vision: Focused on innovation, sustainability, and strategic expansion.
Saatvik Green Energy Limited continues to drive growth and sustainability in the renewable energy sector through cutting-edge technology and a customer-centric approach.
Industry Outlook
Solar Power Market: An Overview
Growth in Renewable Energy Installations
- Renewable energy (RE) capacity, including large hydro, has tripled from ~63 GW in 2012 to ~191 GW in March 2024.
- RE now constitutes ~43% of India’s total installed generation capacity.
- Solar power leads the growth, rising from 0.09 GW in 2012 to ~82 GW by 2024.
Increasing Renewable Energy Share
- The share of RE in India’s total energy supply mix grew from 12% in 2015 to 21% in 2024.
- Solar and wind combined contributed ~11% of the energy supply in 2024.
- By 2029, solar energy is projected to supply 20-21% of total RE generation.
Key Government Initiatives
- Solar Parks Development: Infrastructure setup with financial aid for large-scale solar projects.
- PM-KUSUM Scheme: Supports solar-powered agricultural pumps and small grid-connected plants.
- Rooftop Solar Programme: Incentives for residential rooftop solar installations.
- Green Energy Corridors: Transmission systems for RE projects in multiple states.
Financing Mechanisms
- Funding support from institutions like IREDA, REC, and PFC.
- Green bonds and international loans (e.g., KfW and World Bank).
- Involvement of pension funds and the International Solar Alliance.
Solar Energy Capacity Additions
- Solar accounted for 43% of total RE capacity by 2024, with ~15 GW added in FY24.
- India targets 280 GW of solar energy by 2030 as part of its 500 GW non-fossil fuel capacity commitment.
Key Drivers for Solar Capacity Additions
Declining Module Prices and Tariffs
- Price Trends:
- Global solar module prices fell significantly from $1.78 per Wp in 2010 to $0.22 per Wp by August 2019.
- Prices further dropped to $0.15–$0.20 per Wp by November 2023, easing capital costs.
- Projections:
- Domestic module prices may rise slightly in 2025 due to higher demand but remain 10–15% lower year-on-year.
- International prices could fall by 20–25%, driven by oversupply.
Competitive Solar Tariffs
- Solar power tariffs are consistently lower than coal-based power tariffs.
- Limited developments in thermal power bidding reinforce solar’s cost advantage.
Fiscal and Regulatory Incentives
- Government Schemes:
- PM Surya Ghar: Muft Bijli Yojna (2024) aims to provide free electricity to 10 million households.
- ₹750 billion outlay to support solar installations.
- Bidding Trajectory:
- Annual bids for 50 GW renewable energy capacity (2024–2028).
- Solar parks with land banks and infrastructure reduce execution risks.
Technological Advancements
- Shift to Efficient Technologies:
- Bifacial modules are gaining popularity due to better efficiency and tracker compatibility.
- Monocrystalline technology dominates, with 97% of crystalline silicon (c-Si) production.
- Ongoing Innovations:
- Migration from p-type to n-type cells for higher efficiency.
- Focus on reducing material dependency for sustainable manufacturing.
Outlook of Overall Grid-Connected Solar Energy Capacity Additions
The growth of the solar sector in India is driven by strong government initiatives, technological advancements, and favourable policies. Key highlights include:
- Key Catalysts for Growth:
- Aggressive tendering strategies by the government.
- Advances in solar technology and cost optimisation.
- Affordable financing options and subsidy initiatives, especially in rooftop solar.
- Supportive policies like ISTS charge waivers and sustainability targets.
- Rising grid electricity tariffs and a push for green energy initiatives.
- Projected Capacity Additions (Fiscal 2025-2029):
- National Solar Mission (NSM):
- 3,000 MW commissioned under Phase II Batch II Tranche I.
- 7 GW tendered under Phase II Batch III and Batch IV, with most completed.
- Other Central Schemes:
- SECI initiated ISTS schemes, with ~35 GW already tendered and allocated (including hybrids).
- State Solar Policies:
- ~24 GW is under construction, with an additional ~24 GW expected for bidding by June 2024.
- Public Sector Undertakings (PSUs):
- CPSU programme extended to 12 GW.
- NTPC Group targets ~60 GW renewable energy capacity by 2032.
- NHPC, Indian Railways, and other PSUs are also contributing significantly.
- Rooftop Solar Projects:
- 20-22 GW expected by Fiscal 2029, driven by PM Surya Ghar Yojana and net/gross metering schemes.
- Open-Access Solar Projects:
- 13-15 GW expected by Fiscal 2028, supported by Green Energy Open Access Rules 2022 and favourable state policies.
- Green Hydrogen Production:
- 0.5-1 MTPA production is expected from Fiscal 2026, with a target of 5 MTPA by 2030.
- Anticipated addition of 32-37 GW of solar capacity by Fiscal 2029 to meet hydrogen production goals.
- Global Impact:
- Companies like Amazon and Microsoft are procuring renewable energy in India to offset global GHG emissions, offering opportunities for IPPs to sign PPAs for renewable energy capacities.
Outlook on Rooftop Solar PV in India
Current Capacity
- Grid-connected rooftop solar capacity: 12.92 GW (June 2024).
- Additions of 593 MW in two months of FY 2025, compared to 620 MW in FY 2024.
Target Achievements
- Government target: 40 GW by FY 2026 under rooftop solar systems.
- Total installed capacity (till May 2024): 12.5 GW.
Key Drivers
- States leading additions:
- Gujarat (36%): Benefited from Surya Urja Yojana 2023.
- Kerala (18%): Large roofs per capita offer growth potential.
- Maharashtra (12%): Driven by Surya Urja Yojana.
Market Expansion Factors
- Increased consumer awareness.
- Technological advancements.
- Subsidies by central and state governments.
Cost Advantages
- Global solar module prices: USD 0.18 per watt-peak (June 2024).
Residential Segment Growth
- PM Surya Ghar Yojana: Targets 10 million households with free electricity (300 units/month).
- Expected addition: 20-25 GW by FY 2030.
Regulatory Support
- Net metering allowed for residential and commercial users.
- Excess energy supports discoms’ Renewable Purchase Obligations (RPOs).
Commercial Benefits
- Rooftop solar generation cost: ₹3.5–₹4/unit.
- Attractive for high-tariff consumers (₹4.5+ per unit).
India’s Solar Module Manufacturing Growth and Government Support
- India aims to establish a strong presence in all stages of solar PV manufacturing by 2025-2026.
- The Government of India introduced the PLI scheme in 2020 with INR 45 billion in funding, later enhanced by INR 195 billion in 2023.
- CRISIL MI&A Consulting expects solar PV capacity to reach 125 GW by Fiscal 2029.
- Gujarat will lead in solar module manufacturing, with 55-60% of additions over the next five years.
- Government initiatives support domestic solar module manufacturing, including DCR mandates, safeguard duties, BCD, and ALMM certification.
- Key schemes like PM-KUSUM, CPSU, and the manufacturing-linked tender encourage solar growth.
India’s Solar Module Export Growth
- India’s solar module exports surged by 75% in FY2020, followed by a decline in FY2021. The US Uyghur Forced Labor Prevention Act boosted exports, with growth expected to continue.
India is poised to become a global leader in solar module manufacturing, with a projected 125 GW capacity by 2029. Surplus production, government support, and rising demand from developing countries offer significant export opportunities despite challenges like competition from China and import duties.
Opportunities and Future Growth in the EPC Solar Market in India
- Global Demand: Increasing global focus on clean energy fuels solar growth.
- Government Support: Policies like the Renewable Purchase Obligation drive domestic growth.
- Export Opportunities: Indian companies can tap into international markets.
- Cost Advantage: Competitive pricing and skilled workforce enhance market position.
- Regional Growth: Expansion potential in Asia-Pacific, MENA, and Africa.
- Technological Advancements: Innovations improve efficiency and global competitiveness
How Will Saatvik Green Energy Limited Benefit?
- Rising Solar Energy Capacity
Saatvk can capitalise on India’s solar energy growth, with capacity projected to reach 280 GW by 2030. As solar power becomes a larger portion of India’s energy mix, Saatvk can expand its services in installation, maintenance, and module production to meet demand.
- Government Support and Policies
Government initiatives like the PM-KUSUM Scheme and Rooftop Solar Programme present growth opportunities for Saatvk. These policies incentivise solar energy adoption across sectors, enabling Saatvk to tap into residential, commercial, and agricultural markets by offering solar solutions under these schemes.
- Technological Advancements in Solar Energy
Technological innovations such as bifacial modules and n-type cells are reshaping the solar landscape. Saatvk can benefit by integrating these advanced technologies into its product offerings. By adopting cutting-edge solar tech, Saatvk can enhance efficiency and attract customers seeking state-of-the-art solutions.
- Cost Advantages and Declining Module Prices
With solar module prices declining steadily, Saatvk can reduce production costs and offer competitive pricing. The affordability of solar modules benefitsSaatvk by enabling cost-effective solutions for both residential and commercial clients. This ensures scalability and profitability in the growing market.
- Market Expansion and Export Opportunities
The global demand for clean energy provides Saatvk with export opportunities, particularly in regions like Asia-Pacific, MENA, and Africa. As solar energy adoption increases worldwide, Saatvk can expand its market footprint by offering solar solutions to international clients and diversifying revenue streams.
Peer Group Comparison
| Company Name | Revenue
(₹ million) |
Face Value per Equity Share (₹) | EPS (Basic) (₹) | P/E | RoNW (%) | NAV (₹) |
| Saatvik | 10,879.65 | 2 | 8.96 | 83.21 | 10.77 | |
| Waaree Energies Limited | 116,327.63 | 10 | 48.05 | 60.95 | 30.26 | 158.13 |
| Premier Energies Limited | 31,713.11 | 1 | 6.93 | 176.65 | 35.77 | 15.33 |
Key Insights
- Revenue: Saatvik Green Energy’s revenue stands at ₹10,879.65 million, placing it between Waaree Energies Limited (₹116,327.63 million) and Premier Energies Limited (₹31,713.11 million). This suggests Saatvik is a mid-sized player within the industry, performing better than Premier but far behind Waaree.
- Face Value per Equity Share: Saatvik’s face value per equity share is ₹2, which is relatively low compared to Waaree Energies Limited (₹10) and Premier Energies Limited (₹1). A higher face value often indicates a larger or more established company, but Saatvik’s lower face value could reflect its growth stage.
- EPS (Basic): Saatvik Green Energy reported an EPS (Basic) of ₹8.96, which is higher than Premier Energies Limited (₹6.93) but lower than Waaree Energies Limited (₹48.05). This suggests that while Saatvik is earning better than Premier, its performance lags significantly behind Waaree.
- P/E Ratio: The P/E ratio for Saatvik is not provided, but it would help in understanding the company’s market valuation relative to earnings. Waaree Energies Limited has a moderate P/E ratio of 60.95, indicatingpossible undervaluation. In contrast, Premier Energies has a very high P/E of 176.65.
- Return on Net Worth (RoNW): Saatvik has a RoNW of 10.77%, which is strong but lower than Premier Energies Limited (35.77%) and Waaree Energies Limited (158.13%). Despite not achieving the same level of returns as Waaree, Saatvik demonstrates solid profitability relative to its net worth.
- Net Asset Value (NAV): Saatvik Green Energy’s NAV is 10.77, which is considerably lower than Waaree Energies Limited (₹158.13). This suggests that Waaree has a significantly higher value in terms of assets per share. However, Saatvik’s NAV reflects the potential for growth in its market position.
Saatvik Green Energy Limited IPO Strengths
- Quality Customer Base and Large Order Book
The company benefits from a diversified and growing customer base across various industries and geographies. Its broad customer spectrum ensures consistent revenue and mitigates risks associated with customer concentration. With key clients from sectors such as manufacturing, cement, and infrastructure, it maintains strong relationships globally, including regions like North America and Africa. This large customer base supports significant order volumes and contributes to sustainable growth, providing a steady stream of revenue.
- Integrated Solutions for Independent Power Producers
Recognised as one of India’s few integrated players, the company combines module manufacturing with EPC and O&M services. This unique ability enables it to offer comprehensive solutions that cater to diverse customer needs in the renewable energy sector. By maintaining in-house capabilities in manufacturing, technical support, and quality control, it ensures consistent performance across its solar and EPC projects. This integrated approach strengthens its market position, providing long-term success and enhanced customer satisfaction.
- Strategic Location and Logistical Advantage
The company’s central location in Ambala offers strategic advantages, including excellent connectivity to key markets across India. This location reduces logistical challenges and transit times, improving overall operational efficiency. With proximity to high solar incidence areas and industrial hubs like Haryana and Madhya Pradesh, it can meet the demands of a rapidly growing solar market while maintaining efficient supply chain management. This positioning reinforces its leadership in the North Indian solar module manufacturing sector.
- Innovative Technology Solutions for the Solar Industry
The company stays at the forefront of solar technology by adopting advanced innovations like half-cut, MBB, and N-TopCon modules. This commitment to technological enhancement ensures high durability and efficiency, enabling the company to provide customisable solutions for its customers. With early investments in emerging technologies, it not only meets present demands but also anticipates future market needs, solidifying its competitive edge. Its focus on sustainability and performance makes it a leader in the solar industry.
Key Insights from Financial Performance
- Assets:The company’s total assets have significantly increased, particularly in FY 2024, rising to ₹6,880.38 million from ₹2,629.99 million in FY 2023. This sharp rise indicates expansion or increased investments, reflecting growth in operational capacity or asset acquisition.
- Revenue:Revenue growth has been impressive over the past three years, reaching ₹10,971.81 million in FY 2024. From ₹6,176.27 million in FY 2023, the sharp increase demonstrates enhanced market demand, better sales performance, or expanded business activities, contributing to robust growth.
- Profit After Tax (PAT):Profit After Tax (PAT) surged to ₹1,004.72 million in FY 2024 from ₹47.45 million in FY 2023. The significant rise highlights improved operational efficiency, reduced costs, or better margins, indicating stronger financial health and overall business performance.
- Reserves and Surplus:The reserves and surplus grew substantially to ₹1,172.93 million in FY 2024, compared to ₹168.93 million in FY 2023. This strong increase reflects the company’s ability to retain earnings, which can be reinvested into the business for future growth and stability.
- Total Borrowings:Total borrowings rose to ₹2,634.20 million in FY 2024, an increase from ₹1,444.92 million in FY 2023. The growth in borrowings indicates the company’s reliance on external funding to support expansion, investments, or operational costs, which requires careful monitoring.
- Total Liabilities:Total liabilities grew to ₹5,672.97 million in FY 2024, up from ₹2,427.26 million in FY 2023. The increase is aligned with the company’s higher borrowings and asset base, indicating growth but also raising concerns about managing future liabilities effectively.
Other Financial Details
- Cost of Materials and Services Consumed: The cost increased consistently over the years, rising from ₹3,428.07 crore in FY22 to ₹5,559.25 crore in FY23 and ₹6,553.02 crore in FY24. This indicates growing production or operational scale.
- Employee Benefits Expense: Expenses for employee benefits rose steadily, from ₹76.8 crore in FY22 to ₹101.26 crore in FY23 and ₹170.27 crore in FY24. This indicates workforce expansion or higher employee compensation.
- Finance Costs: Finance costs surged, reflecting higher borrowings or interest rates. The costs increased from ₹40.27 crore in FY22 to ₹105.87 crore in FY23 and ₹142.32 crore in FY24.
- Depreciation and Amortisation: Depreciation costs nearly doubled year-on-year, growing from ₹24.66 crore in FY22 to ₹66.15 crore in FY23 and ₹107.39 crore in FY24. This points to new asset acquisitions or investments in infrastructure.
- Other Expenses: Other expenses increased significantly, from ₹288.09 crore in FY22 to ₹424.09 crore in FY23 and ₹978.99 crore in FY24, reflecting higher administrative or operational costs.
- Total Expenses: Total expenses rose sharply, from ₹4,720.26 crore in FY22 to ₹6,109.63 crore in FY23 and ₹9,653.08 crore in FY24, signifying substantial growth in business activities and scale of operations.
Key Strategies for Saatvik Green Energy Limited
- Backward Integration into Cell Manufacturing
The company aims to enhance its long-term growth by integrating cell manufacturing. With a proposed 4.80 GW cell manufacturing facility and 4.0 GW module capacity in Odisha by 2027, this move reduces reliance on external suppliers, offering cost control, efficiency, and supply chain flexibility while maintaining high-quality production standards and reducing geopolitical risks.
- Maintaining Solar Industry Position & Expanding Global Presence
The company is expanding production capacities and strengthening export sales and EPC services to solidify its position in the solar industry. By establishing a new 4.80 GW cell and 4.0 GW module manufacturing facility in Odisha, it aims to expand its market share both domestically and internationally, offering cost-effective, quality solar solutions across new and existing markets.
- Advancing Technology for Quality Solar Modules
The company focuses on developing superior solar modules by adopting advanced technologies, such as TOPCon solar cells. With continuous investment in R&D, the company aims to improve efficiency, durability, and output, including plans to develop new products like perovskite solar cells, ensuring it remains a leader in technological innovation in the solar industry.
- Expanding Distribution Network and Retail Brand Creation
The company seeks to broaden its distribution network across India and build a retail brand for solar panels. By collaborating with local distributors, optimising logistics, and offering financing options, the company aims to make solar products more accessible in rural and urban markets. Additionally, its focus on marketing, subsidies, and after-sales support will boost solar adoption.
How to apply IPO with HDFC SKY?
Follow these simple steps to apply for an IPO through HDFC SKY. Secure your investments and explore new opportunities with ease by accessing the IPOs available on the platform.
1Login to your HDFC SKY Account
2Select Issue
3Enter Number of Lots and your Price.
4Enter UPI ID
5Complete Transaction on Your UPI App
FAQs On Saatvik Green Energy's IPO
What is the issue size of Saatvik Green Energy's IPO?
The IPO aims to raise ₹1,150 crore, which includes a fresh issue of shares and an offer for sale from existing shareholders.
When is the Saatvik Green Energy IPO expected to open and close?
The opening and closing dates for the Saatvik Green Energy IPO is 19 September 2025 to 23 September 2025
What is the price range for the Saatvik Green Energy IPO?
The price range for the Saatvik Green Energy IPO is ₹442 to ₹465 per share
Where will the Saatvik Green Energy IPO be listed?
Saatvik Green Energy’s IPO will be listed on the BSE (Bombay Stock Exchange) and NSE (National Stock Exchange) once the offering is successfully completed.
When will the allotment of shares be finalised?
The share allotment for Saatvik Green Energy’s IPO will be finalised after the bidding process concludes. Exact dates is expected to be 24 September 2025
When will the listing of shares take place?
The listing date for Saatvik Green Energy’s IPO is expected on 26 September 2025

