- Offerings
- Tools & Platforms
Tools & Calculators
- Open API
- Calculators
- SIP Calculator
- CAGR Calculator
- Compound Interest Calculator
- FD Calculator
- RD Calculator
- EPF Calculator
- Retirement Calculator
- HDFC SIP Calculator
- Mutual Fund Return Calculator
- Lumpsum Calculator
- Step Up SIP Calculator
- ETF SIP Calculator
- Brokerage Calculator
- Equity Margin Calculator
- SWP Calculator
- EMI Calculator
- MTF Calculator
- Pricing
- SKY Learn
- Mutual Funds
- Margin Trading
- Financial Planning
- Personal Finance
- Share Trading
- IPO
- Derivatives
- Currencies
- Intraday Trading
- Trading Strategies
- Demat Account
- Commodity
- ETF
- What is a Shooting Star Candlestick Pattern?
- Structure of the Shooting Star Candlestick Pattern
- Characteristics of a Shooting Star Pattern
- Example of a Shooting Star Candlestick Pattern
- How to Read Shooting Star Candlestick Pattern?
- How to Trade Using the Shooting Star Chart Pattern?
- Benefits and Limitations of Using Shooting Star Candlestick Pattern
- Difference Between Shooting Star and Inverted Hammer
- Things to Know Before Trading with Shooting Star Candlestick
- Conclusion
- FAQs on What is Shooting Star Candlestick Pattern?
What is a Shooting Star Candlestick Pattern & How to Trade Using the Shooting Star Chart Pattern?
By HDFC SKY | Updated at: Oct 6, 2025 07:30 PM IST
- Definition: The Shooting Star is a bearish reversal candlestick pattern that appears after an uptrend, signaling potential price reversal.
- Visual Characteristics:
- Small real body near the candle’s low
- Long upper shadow at least twice the body length
- Little to no lower shadow
- Market Implication:
- Indicates buying pressure was overcome by selling pressure during the session.
- Traders interpret it as a sign of weakening bullish momentum.
- Confirmation:
- Pattern gains strength if followed by a bearish candle.
- High trading volume increases reliability.
- Trading Strategy:
- Entry: Short position below the Shooting Star’s low after confirmation.
- Stop-loss: Above the candle’s high.
- Target: Based on support zones or risk-reward ratios (e.g., 2:1).
- Caution:
- Not foolproof; should be used with other indicators or patterns for confirmation.
- Applicability: Works across timeframes—daily, weekly, and intraday charts.
The Shooting Star Candlestick Pattern is a technical analysis tool used to identify potential trend reversals in the stock market. Characterised by a small real body and a long upper shadow, this pattern signals that buyers tried to push prices higher but sellers gained control, often indicating a bearish reversal. Understanding this pattern can help traders make informed decisions about market entry and exit points.
What is a Shooting Star Candlestick Pattern?
A Shooting Star Candlestick Pattern is a bearish reversal signal in technical analysis. The shooting star candlestick meaning refers to a pattern with a small real body, long upper shadow and little or no lower shadow indicating that buyers pushed prices up but sellers took control by the close. This suggests a potential price decline ahead.
Structure of the Shooting Star Candlestick Pattern
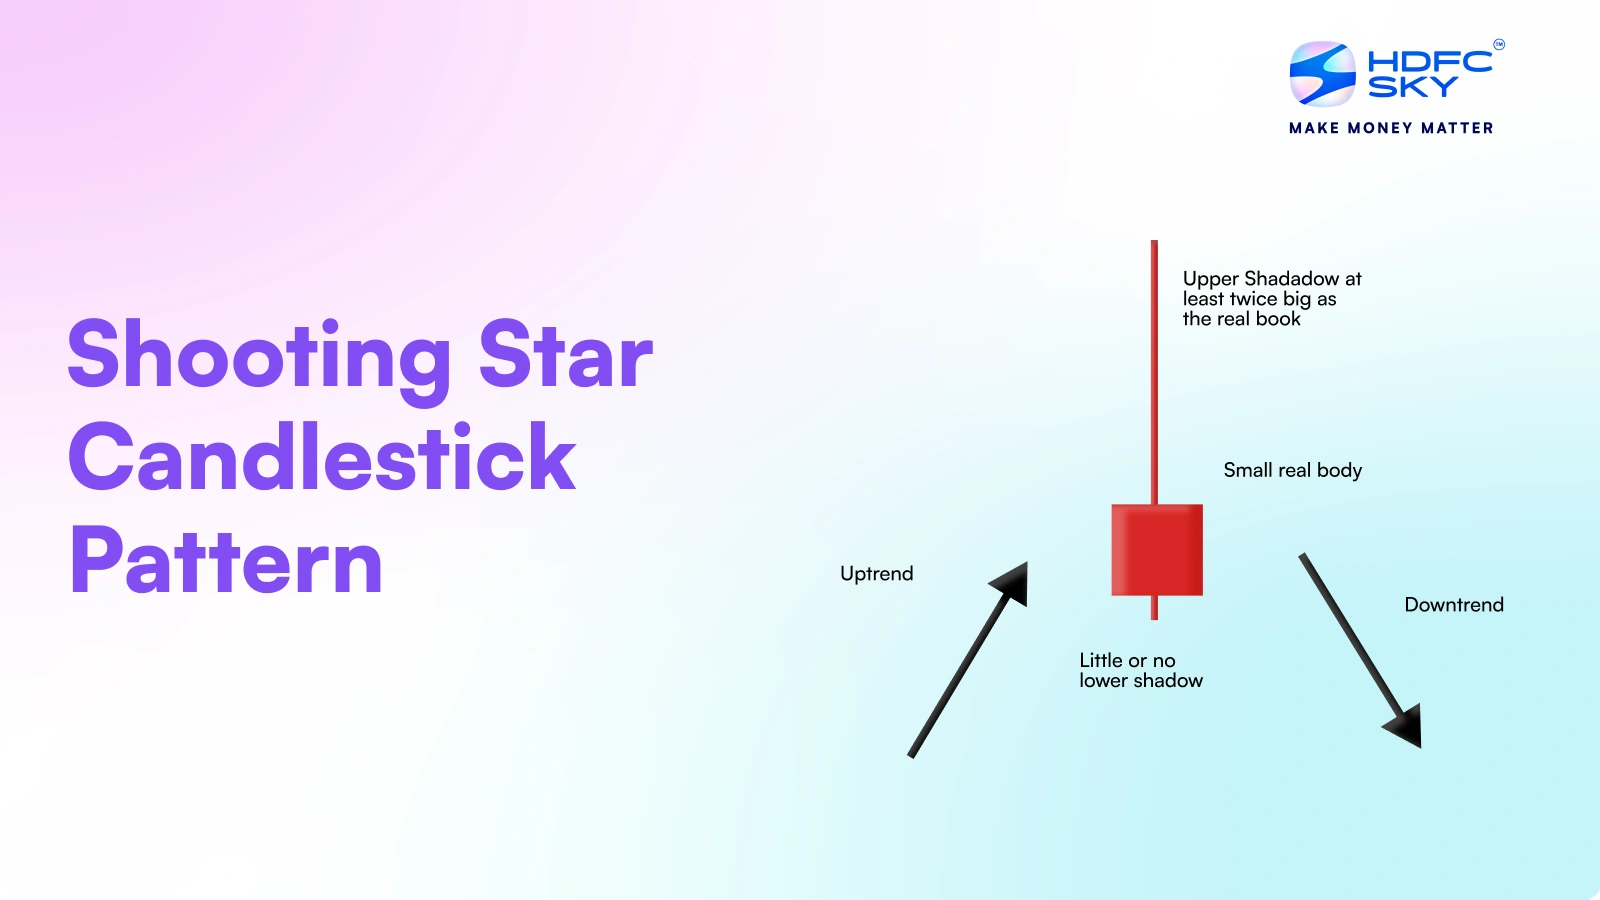
The formation of the shooting star candlestick pattern is precise. Here’s a breakdown of its structure:
- Small Real Body: The candle’s body is typically small, representing a narrow range between the opening and closing prices.
- Long Upper Shadow: The upper shadow is at least twice the length of the body, reflecting a strong upward price movement that was subsequently rejected.
- Little to No Lower Shadow: Minimal or no lower shadow indicates that the price did not drop significantly below the opening price.
This structure is pivotal in distinguishing the shooting star candlestick from other reversal patterns. For example, when the candle is green (or bullish) it may indicate that buyers managed to close the candle at a higher price despite the selling pressure.
However In most cases the pattern is interpreted as a bearish shooting star, implying that the buying trend may be losing momentum.
Characteristics of a Shooting Star Pattern
The Shooting Star pattern is a single candlestick that signals a potential bearish reversal after an uptrend. It reflects weakening buying pressure and rising selling pressure.
- Small real body near the lower end of the candle.
- Long upper shadow at least twice the size of the body.
- Little to no lower shadow.
- Appears after a price rise, indicating a possible trend change.
- Shows that buyers pushed prices up but sellers took control by close.
- Suggests market hesitation and potential reversal ahead.
Example of a Shooting Star Candlestick Pattern
Consider a scenario where a stock in the Indian market has been on a consistent uptrend. Suddenly the price spikes during the day, forming a long upper shadow but the price returns to near its opening level by the close of the session.
This formation is an ideal example of a shooting star candlestick pattern. The significant upper wick shows buyers pushed the price upward aggressively but the inability to maintain the high level suggests that sellers are gaining control.
Traders analysing this candlestick shooting star pattern will see it as a cautionary sign, possibly preparing for a reversal in the prevailing uptrend. Such patterns are not isolated and often occur after prolonged periods of bullish momentum, making their appearance a critical point of analysis in shooting stars in technical analysis.
How to Read Shooting Star Candlestick Pattern?
The Shooting Star candlestick pattern is an indicator of a potential bearish reversal after an uptrend. To read and interpret this pattern effectively, consider the following points:
- Location in Trend: The pattern typically appears at the top of an uptrend, signaling that the upward momentum might be weakening.
- Candle Structure: The candlestick has a small real body (either bullish or bearish) near the lower end of the trading range and a long upper shadow, which should be at least twice the length of the body. This long wick shows that buyers pushed the price significantly higher during the session.
- Price Rejection: The long upper shadow indicates strong selling pressure that overcame the buying, causing the price to close near the opening price or lower. This reflects a rejection of higher prices.
- Volume: Higher trading volume during the formation of the Shooting Star adds credibility to the pattern, indicating that many traders participated in the sell-off.
- Confirmation: The bearish signal becomes stronger if the next candlestick closes below the Shooting Star’s real body, confirming the shift in momentum from buyers to sellers.
How to Trade Using the Shooting Star Chart Pattern?
Trading with the Shooting Star Pattern involves spotting potential reversals after an uptrend. Here’s how to trade it:
- Identify the Pattern: Look for a candlestick with a small real body near the bottom and a long upper shadow after a price rise.
- Confirm the Signal: Wait for the next candle to close below the Shooting Star’s real body to confirm a bearish reversal.
- Enter a Short Position: Consider selling or shorting the stock after confirmation to capitalise on the expected downward move.
- Set Stop-Loss: Place a stop-loss above the high of the Shooting Star candle to manage risk.
- Target Profit: Set profit targets based on support levels or risk-reward ratio, often aiming for a drop similar to the prior uptrend.
This strategy helps traders exit or short stocks showing signs of weakening buying momentum
Benefits and Limitations of Using Shooting Star Candlestick Pattern
The Shooting Star pattern helps traders identify potential trend reversals, offering opportunities to exit long positions or enter short ones. However relying solely on this pattern can lead to false signals without confirming indicators.
Benefits of Using Shooting Star Candlestick Pattern
- Signals potential bearish reversal after an uptrend.
- Easy to spot with a clear candlestick shape.
- Helps in timely decision-making for traders.
- Useful in combination with other technical tools.
Limitations of Using Shooting Star Candlestick Pattern
- Can give false signals if not confirmed by other indicators.
- Less reliable in volatile or sideways markets.
- Requires confirmation with following price action.
- Not effective alone for long-term predictions.
Difference Between Shooting Star and Inverted Hammer
While the shooting star candlestick pattern and the inverted hammer may appear similar they differ in terms of implications:
| Aspect | Shooting Star | Inverted Hammer |
| Trend Location | Appears after an uptrend | Appears after a downtrend |
| Indicates | Potential bearish reversal | Potential bullish reversal |
| Candle Shape | Small real body near the bottom, long upper shadow | Small real body near the bottom, long upper shadow |
| Market Sentiment | Shows rejection of higher prices by sellers | Shows buyers trying to push price up but sellers pulled back |
| Confirmation | Confirmed by a bearish candle after it | Confirmed by a bullish candle after it |
For traders, distinguishing between a bearish shooting star and a bullish shooting star candlestick or inverted hammer is vital to avoid misinterpretation and to make strategic trading decisions.
Things to Know Before Trading with Shooting Star Candlestick
Here’s what you should keep in mind before trading with the Shooting Star candlestick pattern:
- Confirm the Trend: Ensure the pattern appears after a clear uptrend for reliable signals.
- Look for Volume: Higher volume on the Shooting Star day strengthens the reversal signal.
- Wait for Confirmation: Don’t act on the pattern alone, wait for the next candle to confirm the reversal.
- Use Stop-Loss Orders: Protect yourself by placing stop-loss just above the high of the Shooting Star candle.
- Combine with Other Indicators: Use alongside RSI, MACD or support/resistance levels for better accuracy.
- Avoid in Sideways Markets: The pattern is less effective in choppy or sideways trading conditions.
Being cautious with these factors improves the chances of successful trades using the Shooting Star pattern.
Conclusion
The shooting star candlestick pattern is an invaluable tool in technical analysis, offering traders insights into potential market reversals. Whether you’re analysing a green shooting star candlestick or a more traditional bearish variant understanding the formation and implications of this pattern is essential.
Effective shooting star trading relies on combining this pattern with other technical indicators and market analysis techniques. Despite its simplicity, the shooting star candlestick pattern should always be viewed in context, with due attention paid to volume, trend strength and additional signals.
Related Articles
FAQs on What is Shooting Star Candlestick Pattern?
How do you trade the shooting Star pattern?
Trading the shooting star candlestick pattern involves taking short positions once the reversal is confirmed by subsequent candles. Look for confirmation signals like a gap down or a bearish candle following the pattern to reinforce your decision in shooting star trading. Always implement risk management by setting stop-loss orders just above the shooting star’s high to limit losses.
How is a shooting star pattern formed in a stock chart?
The formation of a shooting star candlestick pattern starts in an uptrend with a brief rally, followed by a sharp reversal that creates a small body and a long upper shadow. This indicates that although buyers pushed prices up, sellers regained control by the session’s close.
How do we identify the shooting star pattern?
Identify the shooting star candlestick pattern by looking for a small real body near the lower end of the range, a long upper shadow at least twice the length of the body, and minimal or no lower shadow.
Is a shooting star a bullish candle?
Typically, the shooting star candlestick pattern is seen as bearish due to its reversal implications in an uptrend.
What is the opposite of a shooting star candle?
The opposite of the shooting star candlestick pattern is the inverted hammer. While both share a long upper shadow, the inverted hammer appears in a downtrend and signals a potential bullish reversal, setting it apart from the bearish shooting star.
How reliable is a shooting star pattern in predicting market trends?
The reliability of the shooting star candlestick pattern varies with market conditions. It is most effective when confirmed by additional indicators and volume analysis.

