- Offerings
- Tools & Platforms
Tools & Calculators
- Open API
- Calculators
- SIP Calculator
- CAGR Calculator
- Compound Interest Calculator
- FD Calculator
- RD Calculator
- EPF Calculator
- Retirement Calculator
- HDFC SIP Calculator
- Mutual Fund Return Calculator
- Lumpsum Calculator
- Step Up SIP Calculator
- ETF SIP Calculator
- Brokerage Calculator
- Equity Margin Calculator
- SWP Calculator
- EMI Calculator
- MTF Calculator
- Pricing
- SKY Learn
- Mutual Funds
- Margin Trading
- Financial Planning
- Personal Finance
- Share Trading
- IPO
- Derivatives
- Currencies
- Intraday Trading
- Trading Strategies
- Demat Account
- Commodity
- ETF
- What is Simple Moving Average Trading Strategy?
- How to Calculate a Simple Moving Average?
- Application of Simple Moving Averages in Trading
- How to Trade Using SMA Crossover
- What is Simple Moving Average Technical Analysis?
- Advantages of Simple Moving Average
- Limitations of Simple Moving Average
- Difference between Simple Moving Average & Exponential Moving Average
- Conclusion
- FAQs on Simple Moving Average Trading Strategy
What is Simple Moving Average & How to Calculate a Simple Moving Average?
By HDFC SKY | Updated at: Aug 22, 2025 04:05 PM IST
The simple moving average (SMA) is one of the most widely used technical indicators in trading and investing. It helps smooth out price data by calculating the average of a security’s price over a specific time period. By doing so the simple moving average makes it easier to identify trends and potential entry or exit points in the market.
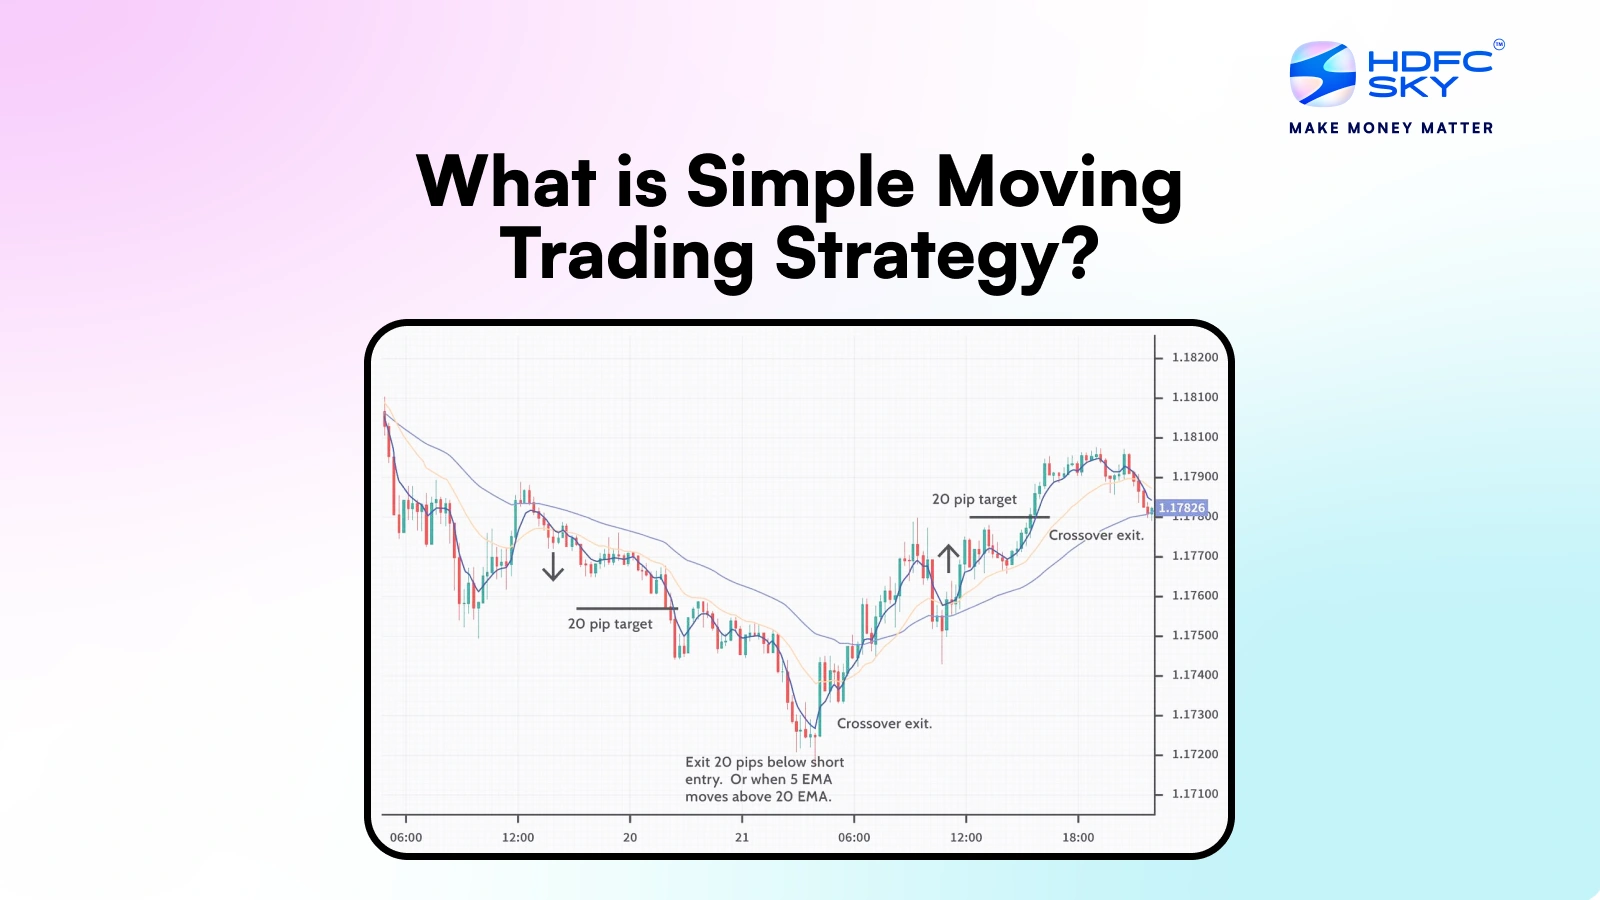
What is Simple Moving Average Trading Strategy?
A Simple Moving Average (SMA) trading strategy involves using the average price of a stock over a specific period to make buy or sell decisions. Traders often use one or more SMAs such as 50-day or 200-day averages to identify trends.
For example:
- Buy Signal: When a short-term SMA (like 50-day) crosses above a long-term SMA (like 200-day), it indicates an uptrend.
- Sell Signal: When the short-term SMA crosses below the long-term SMA, it may signal a downtrend.
This strategy helps traders reduce market noise and base decisions on trend direction
How to Calculate a Simple Moving Average?
SMA or the Simple Moving Average, is not a complicated calculation. It is done by adding the closing prices of an asset over a specific period and dividing by the number of periods. The simple moving average formula is:
SMA = (A1+A2+…+An)/n
Where:
- An = Closing price at period n
- n = Number of total periods
For example, if a stock’s closing prices over 10 days are:
₹2500, ₹2520, ₹2550, ₹2530, ₹2560, ₹2580, ₹2570, ₹2600, ₹2620, ₹2610
Sum = ₹25,040
SMA = ₹25,040 ÷ 10 = ₹2,504
This 10-day SMA helps traders identify trends and market direction. Understanding how to calculate SMA is key to better investment decisions.
Application of Simple Moving Averages in Trading
Here are key applications of Simple Moving Averages (SMA) in trading:
- Trend Identification: SMA helps determine the market trend. If prices stay above the SMA, it’s a bullish signal; below indicates a bearish trend.
- Support and Resistance Levels: SMAs often act as dynamic support or resistance points where price may bounce or reverse.
- Crossover Signals: Traders use SMA crossovers (e.g., 50-day vs. 200-day) to identify entry and exit points.
- Smoothing Price Fluctuations: SMA reduces short-term volatility, helping traders focus on the overall trend.
- Confirmation Tool: SMA is often used with other indicators to confirm signals for better accuracy in trading decisions.
How to Trade Using SMA Crossover
A popular strategy is the SMA crossover, where two SMAs of different time frames are compared:
- Golden Cross: A short-term SMA (e.g., 50-day) crosses above a long-term SMA (e.g., 200-day), signalling a possible uptrend.
- Death Cross: A short-term SMA crosses below a long-term SMA, indicating a potential downtrend.
Short-term traders often use 10-day and 20-day SMAs, whereas long-term investors rely on 50-day and 200-day SMAs to confirm market direction.
What is Simple Moving Average Technical Analysis?
SMA is used in technical analysis to:
- Identify Trends: The direction of the SMA line indicates the prevailing trend. A rising average usually suggests an uptrend, while a falling SMA signals a downtrend. Traders watch for sustained movements above or below the SMA to gauge trend strength.
- Support & Resistance: In a long-term uptrend, the 200-day SMA often acts as a support level. If the price holds above this level multiple times, it reinforces the trend’s strength. In a downtrend, the SMA can act as resistance, potentially capping price rallies.
- Buy & Sell (Crossover) Signals: Prices above an SMA can indicate a buying opportunity, while falling below may suggest selling. This strategy works best when combined with volume analysis for confirmation. A Golden Cross is a bullish signal when a shorter-term SMA (50-day SMA) crosses above a longer-term SMA (200-day SMA).
This suggests upward momentum is building and may indicate a buying opportunity. A Death Cross is a bearish signal when a shorter-term SMA crosses below a longer-term SMA. This indicates potential downward momentum and may be considered a selling or short-selling signal.
While SMA is useful, traders should combine it with other indicators for better accuracy. Understanding how a simple moving average is calculated will help you make better trading choices.
Advantages of Simple Moving Average
The Simple Moving Average (SMA) is a popular technical indicator that helps traders smooth out price data and identify market trends with ease.
- Easy to Understand and Use: SMA is straightforward making it suitable for beginners and experienced traders alike.
- Smoothens Price Data: It filters out short-term fluctuations providing a clearer view of the underlying trend.
- Helps Identify Trends: SMA is effective in spotting long-term market trends by averaging price data over time.
- Useful for Support/Resistance: Traders often use SMA lines as dynamic support and resistance levels.
- Reliable in Stable Markets: It performs well in non-volatile or trending market conditions.
Limitations of Simple Moving Average
The Simple Moving Average (SMA) is a useful trend-following tool but it has some limitations in fast-moving markets. It may lag and give delayed signals.
- Lagging Indicator: SMA is slow to react to recent price changes which can delay buy/sell signals.
- Not Ideal for Volatile Markets: It may generate false signals during rapid price movements or in choppy markets.
- Equal Weight to All Data Points: SMA gives equal importance to all prices in the period ignoring more recent price relevance.
- Unsuitable for Short-Term Trading Alone: Without confirmation from other indicators SMA might not provide reliable short-term insights.
Despite these limitations, SMA remains a valuable tool when used along with other indicators to enhance precision
Difference between Simple Moving Average & Exponential Moving Average
| Feature | Simple Moving Average (SMA) | Exponential Moving Average (EMA) |
| Calculation | Average of prices over a period, equal weighting | Weighted average giving more importance to recent prices |
| Responsiveness | Slower to react to recent price changes | Faster reaction to recent price movements |
| Usefulness | Good for identifying long-term trends | Better for capturing short-term trends and reversals |
| Complexity | Simple to calculate | More complex due to weighting factor |
Conclusion
The simple moving average helps identify market trends by allowing price variations to be evened out. Though it provides a clear view of price direction, it reacts slowly to sudden market shifts. While its simplicity is an advantage, its lagging nature and equal weighting of historical data are key limitations. Consequently, traders often enhance the reliability of SMA signals by combining them with other technical indicators (like RSI, MACD, or volume analysis) and risk management techniques.
Related Articles
FAQs on Simple Moving Average Trading Strategy
Which one is better, SMA or EMA?
SMA is better for identifying long-term trends due to its smoothness, while EMA responds faster to recent price changes, making it ideal for short-term trading. Choose based on your strategy.
what is the purpose of a simple moving average?
The purpose of a Simple Moving Average (SMA) is to smooth out price data by creating a constantly updated average price. This helps traders identify trends and potential buy or sell signals by reducing market noise.
How are SMA or Simple Moving Averages used in any technical analysis?
The simple moving average helps traders identify trends by softening price swings. If the SMA rises, the asset is likely in an uptrend; if it falls, it signals a downtrend. Traders use it to confirm buy or sell signals, analyse support and resistance levels, and spot market reversals effectively.
How does the Simple Moving Average crossover strategy work?
A moving average crossover signal indicates a trend change. A bullish crossover usually occurs when a short-term SMA moves above a long-term SMA, indicating a potential uptrend and buy signal. A bearish crossover happens when the short-term SMA drops below, suggesting a downtrend and a sell opportunity. Key patterns include the golden cross (bullish) and the death cross (bearish).
What are the characteristics of a Simple Moving Average?
The simple moving average is a customisable tool that adapts to different time frames, making it useful for various market strategies. It smooths price fluctuations but lags behind real-time movements. Shorter SMAs respond quickly to market volatility, while longer SMAs provide more stable signals, helping traders analyse trends effectively.
How often should traders adjust their SMA settings?
SMA settings depend on market conditions and trading goals. Short-term traders may adjust settings frequently, using 10-day or 20-day SMAs, while long-term investors prefer 50-day or 200-day SMAs. Adjustments should be based on volatility, asset type, and strategy to ensure the simple moving average aligns with market trends.

