- Offerings
- Tools & Platforms
Tools & Calculators
- Open API
- Calculators
- SIP Calculator
- CAGR Calculator
- Compound Interest Calculator
- FD Calculator
- RD Calculator
- EPF Calculator
- Retirement Calculator
- HDFC SIP Calculator
- Mutual Fund Return Calculator
- Lumpsum Calculator
- Step Up SIP Calculator
- ETF SIP Calculator
- Brokerage Calculator
- Equity Margin Calculator
- SWP Calculator
- EMI Calculator
- MTF Calculator
- Pricing
- SKY Learn
- Mutual Funds
- Margin Trading
- Financial Planning
- Personal Finance
- Share Trading
- IPO
- Derivatives
- Currencies
- Intraday Trading
- Trading Strategies
- Demat Account
- Commodity
- ETF
- What Is Support and Resistance in the Stock Market?
- How do Support and Resistance Work?
- Importance of Support and Resistance Levels in the Stock Market
- Types of Support & Resistance
- How to Map Support and Resistance Levels?
- Are Support and Resistance Levels Reliable?
- Conclusion
- FAQs on What is Support and Resistance in Stock Market?
What Is Support and Resistance in the Stock Market & How do Support and Resistance Work?
By HDFC SKY | Updated at: Sep 9, 2025 05:06 PM IST
Support and resistance are fundamental concepts in technical analysis helping traders forecast market movements. By analysing support and resistance in stock market charts investors can identify key price levels where trends may pause, reverse or break out making these tools vital for informed trading decisions.
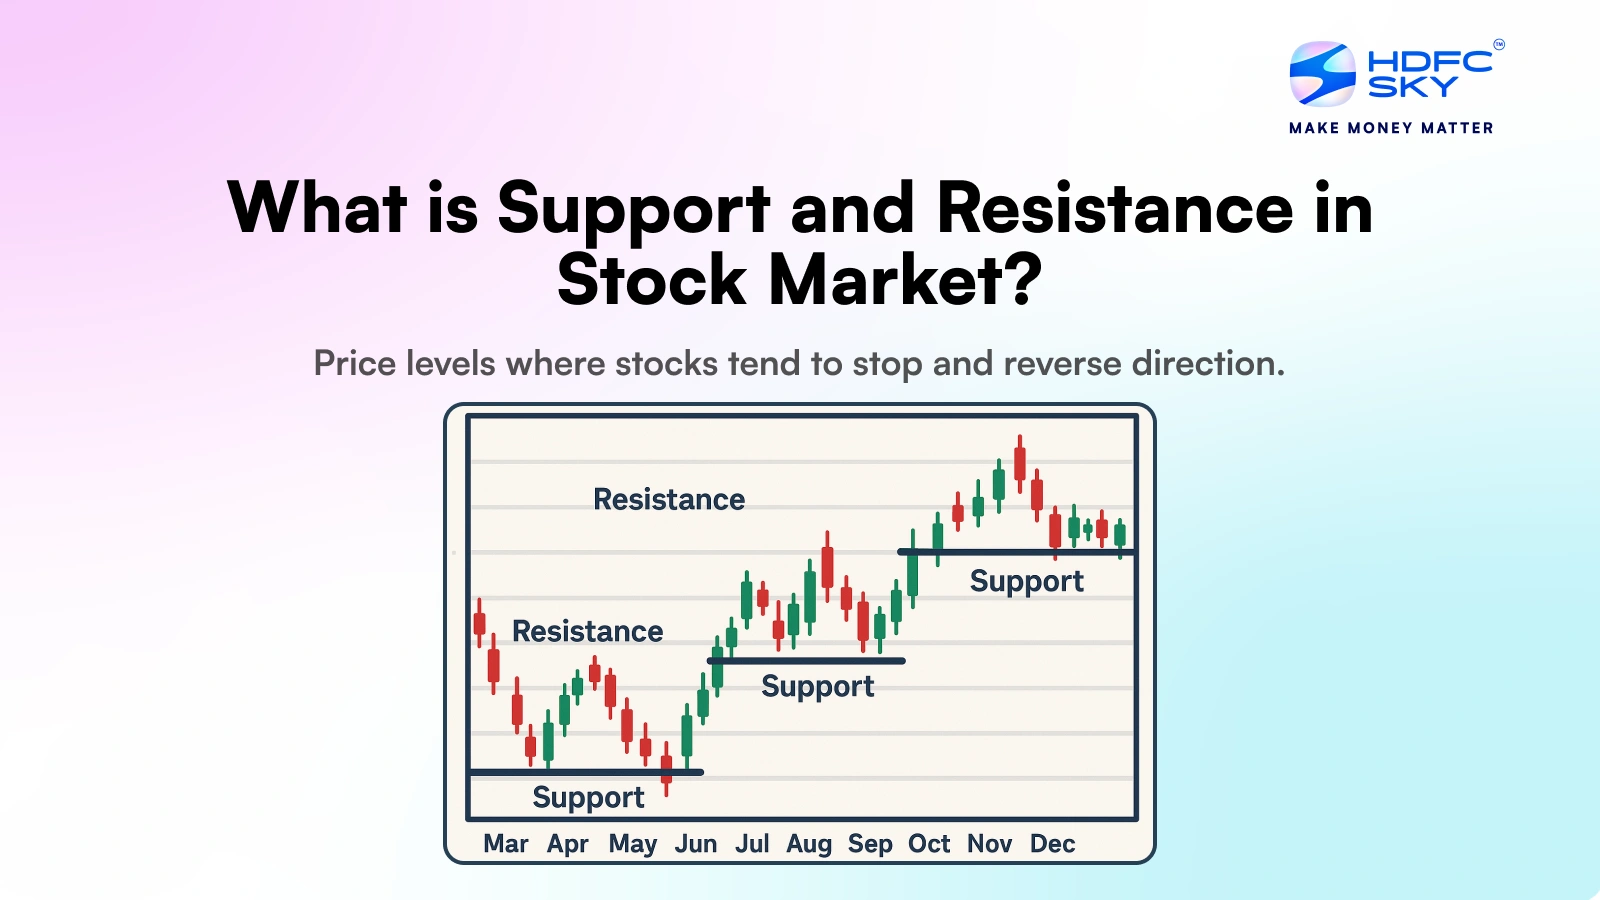
What Is Support and Resistance in the Stock Market?
Support and resistance in the stock market are essential tools used in technical analysis to identify price levels where a stock tends to reverse or pause its movement. Support acts like a price floor where buying interest prevents the price from falling further. On the other hand resistance acts like a ceiling where selling pressure stops the price from rising. These levels help traders predict market behavior and make informed decisions on entry and exit points. They are widely used in chart analysis to spot trends and potential breakouts.
How do Support and Resistance Work?
Support and resistance are fundamental concepts in technical analysis that help traders identify potential price turning points. Support refers to a price level where a stocks or asset tends to find buying interest strong enough to prevent further decline. On the other hand resistance is a level where selling pressure typically halts upward movement. These levels act like invisible barriers on a price chart. When prices approach support they often bounce back up and when they near resistance they tend to pull back. However if these levels are broken with strong momentum it can signal the start of a new trend making them crucial tools for planning entry and exit points in trading.
Importance of Support and Resistance Levels in the Stock Market
Support and resistance levels are essential tools in technical analysis. They help investors understand market psychology and make informed decisions:
- Guide for Entry and Exit: Traders use these levels to time their trades more effectively.
- Trend Confirmation: Helps confirm whether a trend is continuing or reversing.
- Stop-Loss Placement: Investors can place stop-loss orders just below support or above resistance to manage risk.
- Market Sentiment Indicator: Repeated testing of these levels without breaking indicates strong investor sentiment.
In short understanding support and resistance helps you trade smarter by anticipating price moves and managing risk.
Types of Support & Resistance
In technical analysis support and resistance come in various forms based on price behaviour and chart patterns. Understanding their different types helps traders support and resistance indicators identify key levels for entry, exit and risk management.
- Horizontal Support and Resistance: These are flat price levels where the price repeatedly reverses.
Example: A stock repeatedly bounces up from ₹100 (support) and falls after hitting ₹120 (resistance) forming a clear horizontal range. - Trendline Support and Resistance: Formed by connecting higher lows (support) or lower highs (resistance) during a trend.
Example: In an uptrend a stock consistently finds support along an upward-sloping line connecting rising lows. - Moving Average Support and Resistance: Moving averages like the 50-day or 200-day act as dynamic levels where prices may reverse.
Example: A stock bounces off its 200-day moving average multiple times, confirming it as a support level. - Fibonacci Levels: Derived from Fibonacci ratios (38.2%, 50%, 61.8%) used to spot likely retracement zones.
Example: A stock rallies then retraces to 61.8% of the move before continuing upward, showing Fibonacci support. - Psychological Support and Resistance: Round numbers often act as key psychological barriers due to trader behavior.
Example: A stock struggles to break above ₹1,000; traders treat it as a major resistance level. - Pivot Points: Calculated using the previous day’s high, low and close useful for intraday levels.
Example: A trader uses daily pivot points to find support at ₹950 and resistance at ₹980 during
How to Map Support and Resistance Levels?
Mapping support and resistance involves identifying key price levels where a stock tends to reverse or consolidate. Here’s how to do it:
- Use Historical Price Data: Look for areas where the stock price has bounced off multiple times in the past.
- Identify Highs and Lows: Recent swing high = resistance levels; swing lows = support levels.
- Use Line or Candlestick Charts: Visual patterns help spot flat or sloping levels of support/resistance.
- Apply Technical Indicators: Tools like Moving Averages, Fibonacci retracement and trendlines help confirm key levels.
- Look for Volume Spikes: High trading volume near certain levels can strengthen their reliability.
- Switch Between Timeframes: Use multiple timeframes (daily, weekly, monthly) for a broader view.
These levels are not exact prices but zones watch how price reacts near them for smarter trading decisions.
Are Support and Resistance Levels Reliable?
Support and resistance levels are widely used in technical analysis to predict potential price movements. While they often act as barriers where prices bounce or reverse, they are not foolproof. Their reliability depends on market context, volume and how often the level has been tested. Traders use them along with other tools for better decision-making.
Key Points:
- Works Best in Ranging Markets: Prices tend to respect these levels more in sideways trends.
- More Reliable with Volume Confirmation: Strong reactions with high volume increase trust in the level.
- Repeated Testing Strengthens the Level: The more a level is tested and holds, the more significant it becomes.
- May Fail in News-Driven Markets: Sudden news or events can easily break support/resistance zones.
- Should Be Used with Other Indicators: RSI, MACD or trendlines improve accuracy when used together.
Conclusion
Support and resistance are essential concepts in technical analysis guiding traders on potential entry and exit points. While they provide valuable insights into investor psychology and price behaviour they are not absolute indicators. Their effectiveness improves when combined with tools like moving averages, RSI, MACD and volume analysis. By understanding these levels and their limitations traders can make smarter and more informed trading decisions.
Related Articles
FAQs on What is Support and Resistance in Stock Market?
What is the main difference between support and resistance?
Support is a price point where buying pressure is sufficient to stop further decline, functioning as a market “floor.” Resistance is the price level where selling pressure is strong enough to prevent the price from rising further, acting as a “ceiling”.
Can support and resistance levels change over time?
Indeed, as market conditions alter, so may the levels of support and resistance. New pricing trends, changes in supply and demand, or outside variables like news about the economy can change these levels. Roles can change when a level is broken, turning prior opposition into support and vice versa.
What roles support and resistance play in trading strategies?
Finding entry and exit points requires an understanding of support and opposition. Traders utilise resistance to identify possible selling points and support to identify purchasing chances. The foundation of many trading methods, they also assist in establishing price goals and stop-loss orders.
What happens when support and resistance are broken?
When the price falls below support, it could signal a downtrend, whereas breaking resistance often suggests an uptrend. Traders may react accordingly, as these levels can switch roles; support turning into resistance and resistance becoming support.
How can identifying support and resistance levels help traders?
Identifying support and resistance levels helps traders make informed decisions on when to enter or exit trades. These levels allow traders to predict potential price reversals, set stop-losses, and manage risk effectively. Recognising key levels also helps traders stay aligned with prevailing market trends.
How can market psychology influence support and resistance levels?
Market psychology influences support and resistance because traders’ collective emotions, such as fear and greed, dictate buying and selling behaviour. These emotional responses can reinforce support and resistance levels, with certain price points being seen as psychological barriers, often causing prices to stall or reverse at these levels.
What timeframes are ideal for identifying support and resistance levels?
The ideal timeframes depend on the trader’s strategy. Short-term traders typically use smaller timeframes, such as 5-minute or hourly charts, to identify intraday support and resistance. Long-term traders may use daily, weekly, or monthly charts to spot significant support and resistance levels for longer-term trend analysis.

