- Offerings
- Tools & Platforms
Tools & Calculators
- Open API
- Calculators
- SIP Calculator
- CAGR Calculator
- Compound Interest Calculator
- FD Calculator
- RD Calculator
- EPF Calculator
- Retirement Calculator
- HDFC SIP Calculator
- Mutual Fund Return Calculator
- Lumpsum Calculator
- Step Up SIP Calculator
- ETF SIP Calculator
- Brokerage Calculator
- Equity Margin Calculator
- SWP Calculator
- EMI Calculator
- MTF Calculator
- Pricing
- SKY Learn
- Mutual Funds
- Margin Trading
- Financial Planning
- Personal Finance
- Share Trading
- IPO
- Derivatives
- Currencies
- Intraday Trading
- Trading Strategies
- Demat Account
- Commodity
- ETF
- Formation of the Three Inside Down Candlestick Pattern
- Example of the Three Inside Down Candlestick Pattern
- How to Identify the Three Inside Down Candlestick Pattern and what does it indicate?
- When Does Three Inside Down Candlestick happen?
- How to Interpret and Trade the Three Inside Down Candlestick Pattern?
- Strategies to Trade with Three Inside Down Candlestick Pattern
- Advantages and Disadvantages of Three Inside Down Candlestick Pattern
- Conclusion
- FAQs on Three Inside Down Candlestick Pattern?
Three Inside Down Candlestick Pattern?
By HDFC SKY | Updated at: Jul 24, 2025 06:25 PM IST
- Pattern Overview: The Three Inside Down candlestick pattern is a bearish reversal signal that typically forms at the end of an uptrend, indicating a potential shift to a downtrend.
- Formation Details:It consists of three candles:
- First Candle: A large bullish (green) candle.
- Second Candle: A smaller bearish (red) candle that fits completely within the body of the first.
- Third Candle: A strong bearish candle closing below the first candle’s open, confirming the reversal.
- Psychological Interpretation: Signals waning bullish momentum and rising bearish sentiment, with the third candle showing sellers gaining control.
- Trading Strategy:
- Entry Point: Consider short positions after the third candle closes below the first candle’s low.
- Stop Loss: Place above the high of the first candle.
- Target: Use support levels or risk-reward ratio (e.g., 1:2) to define exit.
- Best Practices: Confirm the pattern using technical indicators (e.g., RSI, volume) for more reliable signals. Avoid trading it in sideways markets.
Three stick candlestick pattern indicates a bearish reversal from a bullish trend. It has three candles. The first one is a bullish candle. The second one may be bullish or bearish but its closing price is always below the closing price of the first candle. The third candle confirms the bearish reversal with its closing price below the closing price of the second candle.
The three inside down candlestick pattern is a technical analysis formation that many stock market traders rely on, to identify potential bearish reversals. This pattern belongs to the broader family of inside candlestick patterns, specifically highlighting a setup where market sentiment is shifting from bullish to bearish.
Formation of the Three Inside Down Candlestick Pattern
The formation of the three inside down candlestick pattern is a three step process The importance of each candle is discussed below:
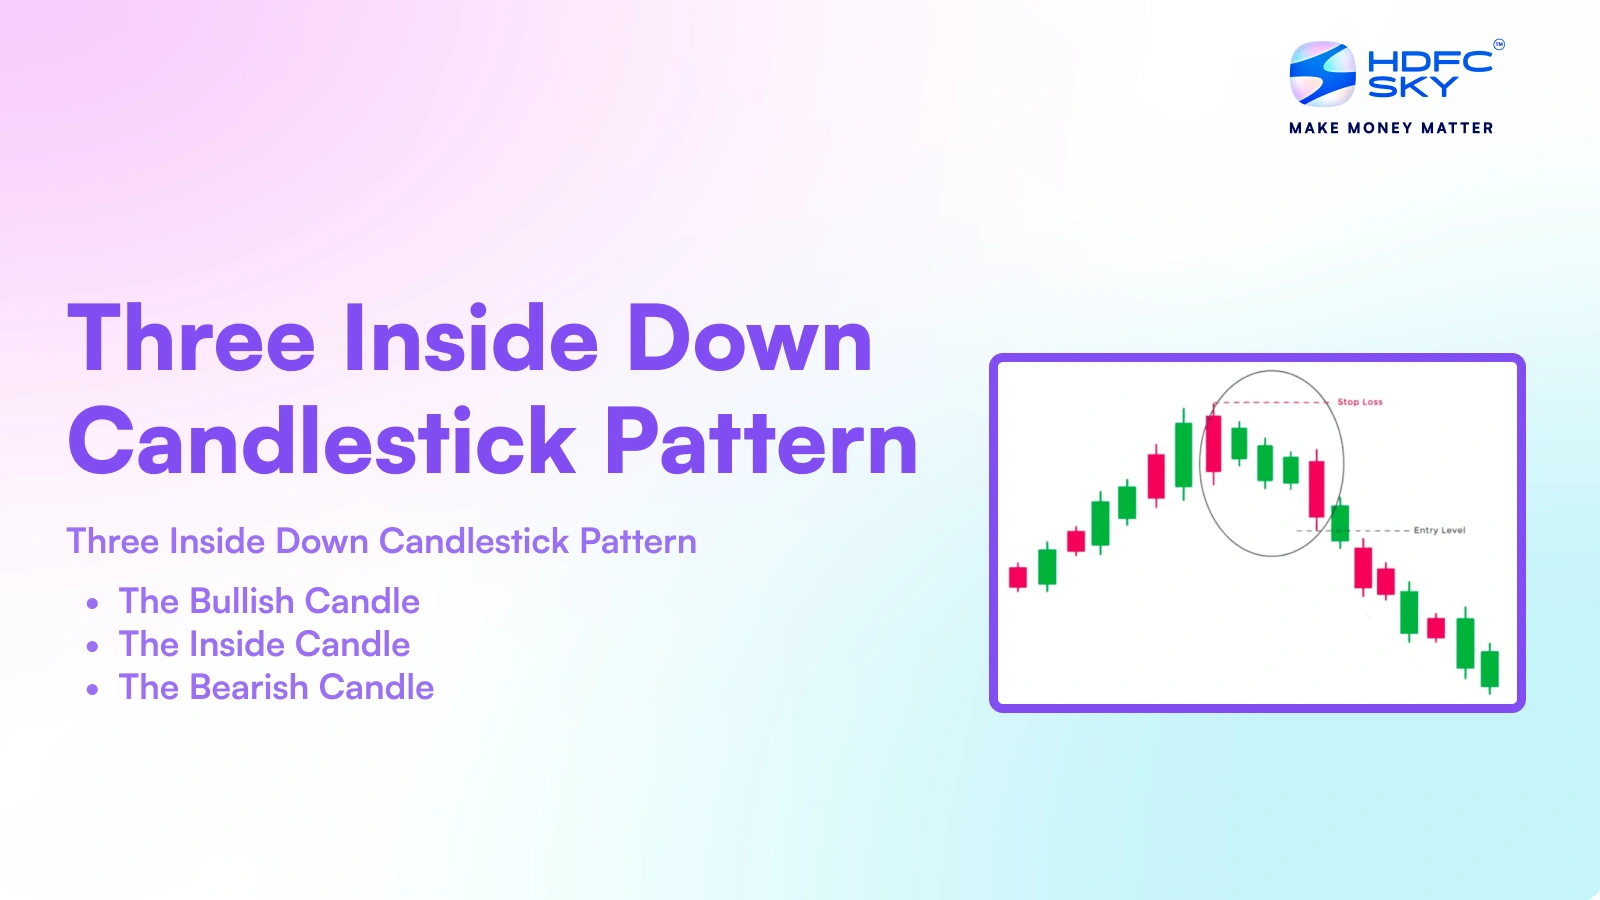
- First Candle (The Bullish Candle): The pattern starts with a bullish candle, signaling a continuation of the uptrend. This candle has a long body, which shows that there is substantial buying interest.
- Second Candle (The Inside Candle): The next candle is smaller (which can be bullish or bearish), completely engulfed by the high and low of the first candle. Its size and placement indicate uncertainty and a pause in the prevailing trend. When this inside candle appears, traders note that the market is potentially losing momentum. This candle is sometimes called the “three-inside candle” because it sits neatly inside the previous day’s range.
- Third Candle (The Bearish Candle): The final candle is bearish and ideally should close below the low of the first candle. This candle’s decisive downward movement confirms the bearish reversal and signals that sellers have taken control. This final move solidifies the pattern as a 3 inside down candle pattern or, more elaborately, as a 3 inside down bearish reversal candlestick pattern.
Traders who can spot the subtle changes in market behavior during the formation of the three inside-down candlestick patterns are better equipped to make timely decisions about whether to exit long positions or enter a short position.
Example of the Three Inside Down Candlestick Pattern
Imagine a scenario where a stock has been on an uptrend. On Day 1, the stock closes significantly higher, forming a long bullish candle. On Day 2, the price action shows a narrow range; the candle forms completely within the range of Day 1’s candle, hinting at market hesitation. On Day 3, the stock opens near the high of the previous day but then gives in to selling pressure, closing well below the low of Day 1.
This sequence is a textbook example of the three inside down candlestick pattern. Such an example illustrates how the bullish momentum erodes and confirms that the sellers have stepped in decisively. This clear visual representation makes the pattern attractive to technical traders. Combined with other technical indicators or trend analysis, this pattern can significantly boost confidence in predicting a reversal.
How to Identify the Three Inside Down Candlestick Pattern and what does it indicate?
Identifying the three inside down candlestick pattern involves looking for the three specific candles and analysing their relationship:
- First Candle: Look for a strong bullish candle that suggests a strong uptrend. This candle sets the stage by indicating robust buying activity.
- Inside Candle: The second candle should have its high and low within the range of the first candle. This signals that the market is in a state of indecision.
- Third Candle: Finally, the third candle must be bearish and close below the low of the first candle. This is the confirmation of the pattern, as it shows that the bearish pressure is now in command.
When these elements come together, the three inside down candlestick pattern indicates that a trend reversal might be imminent. It warns traders that what was once a bullish trend could soon turn bearish, making it a critical signal for those who are planning their entries and exits in the market.
When Does Three Inside Down Candlestick happen?
The three inside down candlestick pattern typically occurs at the top of an uptrend, serving as a precursor to a trend reversal. It is most effective when it appears after a sustained period of bullish momentum. Traders often look for this pattern at resistance levels or after an extended rally, where the market might be overbought and due for a correction.
In practical terms, the pattern is more likely to form in markets where volatility is present, as the fluctuation in prices makes the inside candle to occur. However, even in less volatile markets, the pattern can be a reliable signal if other technical indicators confirm a shift in sentiment. Therefore, timing and context are crucial when evaluating the significance of the three inside down candlestick pattern.
How to Interpret and Trade the Three Inside Down Candlestick Pattern?
Interpreting and trading the three inside down candlestick pattern requires a combination of technical analysis, risk management, and an understanding of market conditions. You can consider the following steps in order for trade confirmation with this pattern:
- Confirmation is Key: Always wait for the formation of the three candles, particularly the bearish confirmation of the third candle. Relying solely on the first two candles can lead to false signals.
- Volume Analysis: Volume increase during the formation of the third candle can serve as additional confirmation signal that sellers are driving the market. High volume reinforces the pattern’s validity.
- Support and Resistance: Look for confluence with key support and resistance levels. If the pattern appears near a significant resistance level, it could enhance the likelihood of a reversal.
- Stop-Loss Placement: To manage risk, place stop-loss orders just above the high of the inside candle or the first bullish candle. This can help minimize losses if the market does not follow through with the bearish move.
- Combine with Other Indicators: Use complementary technical indicators such as the Relative Strength Index (RSI), Moving Averages, or MACD to add an extra layer of confirmation to your trading decision.
By integrating these elements, traders can improve their interpretation of the three inside down candlestick pattern, making it a practical tool for predicting trend reversals and informing trading strategies. However, it’s important to note that, like any trading strategy, the three inside down candlestick pattern is not foolproof and carries its own set of risks and challenges, which we will also discuss in this article.
Strategies to Trade with Three Inside Down Candlestick Pattern
For traders aiming to capitalize on the three inside down candlestick pattern trading strategy, a structured approach is essential. Here are several strategies that can be effective in trading this pattern:
- Reversal Trading: This is the most common strategy. In this strategy, traders short the stock or asset after confirming the pattern. Entering a short position as soon as the third candle closes below the first candle’s low allows you to capture a significant downward move potentially.
- Breakout Confirmation: Some traders prefer waiting for an additional confirmation candle after the pattern forms. This extra step ensures that the bearish move is not just a temporary retracement, reducing the risk of false signals.
- Divergence Confirmation: Combine the pattern with indicators like RSI. If the RSI shows bearish divergence at the time the pattern is forming, it further strengthens the case for a trend reversal.
- Risk Management Strategy: Use trailing stops to lock in profits as the price continues to fall. This approach helps protect gains if the reversal momentum fades before reaching the anticipated target.
- Multi-Timeframe Analysis: Analyze the pattern across different timeframes. While the three inside down candlestick pattern is often used in shorter timeframes, confirming its presence on a higher timeframe chart (e.g., daily or weekly) can provide additional validity to your trade setup.
These strategies underscore the importance of context and confirmation when trading the three inside down candlestick pattern. Being methodical and patient can help traders avoid common pitfalls and enhance the potential for a profitable trade.
Advantages and Disadvantages of Three Inside Down Candlestick Pattern
Like any technical analysis tool, the three inside down candlestick pattern has its own set of advantages and disadvantages:
Advantages of Three Inside Down Candlestick Pattern
- Clear Reversal Signal: The pattern indicates that an uptrend might be reversing. This clarity helps traders make informed decisions.
- Easy to Spot: Its formation is relatively straightforward, making it accessible even to less experienced traders who understand basic candlestick charting.
- Integration with Other Tools: The pattern works well with other technical indicators, such as volume and RSI, to confirm the signal further.
- Risk Management: The setup allows for precise stop-loss placements, which can help manage risk and protect capital.
Disadvantages of Three Inside Down Candlestick Pattern
- False Signals: Like any single indicator, the three inside down candlestick pattern can sometimes produce false signals, particularly in choppy or low-volume markets.
- Timeframe Sensitivity: The pattern’s effectiveness can vary depending on the timeframe. A pattern that works well on a daily chart might not be as significant on an intraday chart.
- Requires Confirmation: Traders are advised to wait for confirmation from the third candle, which might result in delayed entry and potential missed opportunities in fast-moving markets.
- Subjectivity in Interpretation: The pattern’s reliability may depend on the trader’s interpretation and experience. Slight differences in candle size or positioning can lead to different conclusions about its validity.
Conclusion
In conclusion, the three inside down candlestick pattern is a powerful tool in technical analysis that provides early signals of a bearish reversal in an uptrend. By understanding its formation, traders can interpret market sentiment shifts with greater clarity. The pattern not only aids in identifying potential reversals but also integrates well with other technical indicators, making it a versatile component of a trader’s strategy.
Learning how to identify and trade the three inside down candlestick pattern can add significant value to your trading strategy. However, as with any technical tool, success lies in confirming the signal with additional indicators, maintaining strict risk management practices, and continuously adapting to market conditions.
Related Articles
FAQs on Three Inside Down Candlestick Pattern?
How does the three inside down pattern signal a trend shift?
The three inside down pattern signals a probable trend shift from a bullish trend to a bearish one. It starts with a strong bullish candle, followed by an inside candle indicating market indecision, and culminates in a bearish candle that decisively closes below the prior candle’s low. This sequence indicates that buyers are losing control and sellers are taking over.
Can the Three Inside Down pattern be used in different timeframes?
Yes, while the pattern is most commonly observed on daily charts, it can be applied to various timeframes. However, due to increased market noise, its reliability might differ with shorter timeframes. Traders are advised to confirm the pattern on higher time frames for stronger validation.
Is the Three Inside Down Candlestick Pattern bullish or bearish in nature?
The pattern is inherently bearish. It is designed to signal a reversal from an uptrend to a downtrend making it a critical tool for identifying potential sell signals or short-selling opportunities.
What is the opposite of the Three Inside Down Candlestick Pattern?
The opposite pattern is known as the three inside up candlestick pattern. In this reversal formation, a bearish candle is followed by an inside candle and then a bullish candle that closes above the first candle’s high, indicating a potential reversal from a downtrend to an uptrend.
What is the ideal way for traders to trade this pattern?
The ideal way to trade the three inside down candlestick pattern is to wait for the confirmation of the bearish third candle. Combine the pattern with volume analysis and other technical indicators, such as RSI or Moving Averages.
How to Use the Three Inside Down Pattern to Your Advantage?
Traders can use the three inside down candlestick pattern to their advantage by integrating it into a broader trading strategy.

