- Offerings
- Tools & Platforms
Tools & Calculators
- Open API
- Calculators
- SIP Calculator
- CAGR Calculator
- Compound Interest Calculator
- FD Calculator
- RD Calculator
- EPF Calculator
- Retirement Calculator
- HDFC SIP Calculator
- Mutual Fund Return Calculator
- Lumpsum Calculator
- Step Up SIP Calculator
- ETF SIP Calculator
- Brokerage Calculator
- Equity Margin Calculator
- SWP Calculator
- EMI Calculator
- MTF Calculator
- Pricing
- SKY Learn
- Mutual Funds
- Margin Trading
- Financial Planning
- Personal Finance
- Share Trading
- IPO
- Derivatives
- Currencies
- Intraday Trading
- Trading Strategies
- Demat Account
- Commodity
- ETF
What is Time Frame in Trading? Trading Strategies
By HDFC SKY | Updated at: May 15, 2025 01:27 PM IST
What is Time Frame in Trading?
Traders need to understand the market trend to make money. As we have learnt previously, trading strategies are always developed on patterns in the price and volume action and their momentum. It is known that traders pick various timeframes on a chart depending on their trading styles.
These time frames can be hourly, daily, weekly, monthly or yearly, and are necessary to identify the trends and develop trading strategies, including an effective time trading strategy.
For instance, below are the general timeframes that various types of traders rely upon:
Intraday: 15 min/30 min
Swing trader: 2 hour/1 day
Position trader: 1 day/1 week
However, is it possible that you can use multiple time frames to improve your chances of success? The answer is yes.
The multi-time frame trading strategy uses two different charts of different durations of the same stock. These durations depend on the duration of the trade.
Using this time trading strategy, traders use long-term price charts to identify trades on short-term time charts.
How does a Multi Time Frame Trading Strategy Work?
An intraday trader may track the 2-hour time frame and the 15-minute time frame price charts. Similarly, a swing trader can look at a 3-hour chart along with a daily chart.
Here, it is essential to judge what a stock is saying in the longer time frame and shorter time frame. This means determining the trend that the stock price chart depicts in the longer and shorter time frame.
Traders can use signals from this chart to do the following things:
- Confirm reversal if trend on longer-term time starts following trend on shorter-term
- Refute reversal and/or confirm continuation if longer-term trend does not follow shorter-term trend.
This approach is central to a robust time trading strategy.
Example.
Here’s the Nifty daily chart from May 2021 through to October 2021 when the market was in an uptrend.
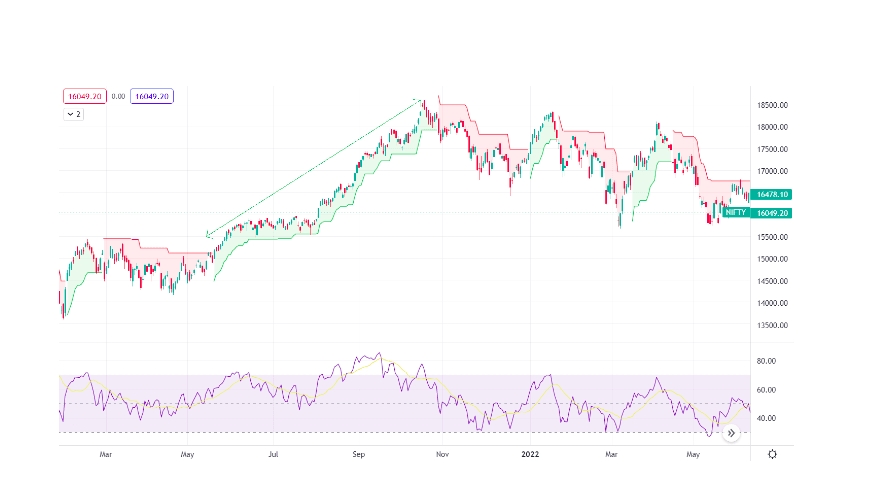
The uptrend in the above example is confirmed by the Supertrend as well as the RSI staying above 50. Traders can use their own signal such as moving averages, MACD or even chart patterns.
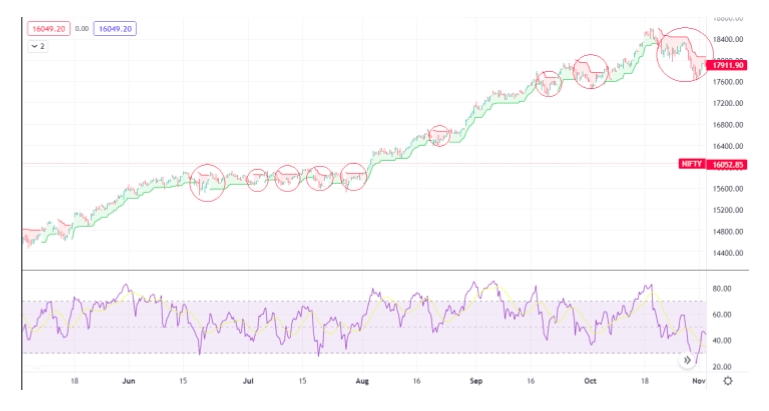
However, as you can see in your below 2-hour chart from the same timeframe, the Supertrend confirmed short-term downtrends multiple times during the same period, highlighting the importance of a proper time trading strategy.
Things to Consider While Using Time frame Based Trading Strategies
So what happens when the trends shown in both the charts, i.e., long duration chart and short duration charts, are different? As in our example, if the longer time frame is giving a buy signal while the chart in the shorter time frame is showing a sell signal, what should you do?
In such a case, remember the following points:
- For a swing trader, short term sell signal combined with a long-term buy signal can be a handy buy-on-dips market when using a good time trading strategy.
- Conversely, a long-term sell signal combined with a short-term sell signal means you are in a sell-on-rise market.
- A confirmation that the longer-term trend has changed will be confirmed when it starts following the short-term trend, as we can see towards the end of the chart in the above example.
In conclusion, understanding and utilising different time frames in trading is useful for identifying trends and developing effective trading strategies. By using a multi-time frame trading strategy, traders can Potentially improve their chances of success by analysing both long-term and short-term price movements.
Related Articles
FAQs on What is Time frame in Stock Market?
What is a time frame in trading?
A time frame in trading refers to the specific duration used to analyze price movements on a chart. Common time frames include hourly, daily, weekly, monthly, and yearly.
What is a multi-time frame trading strategy?
A multi-time frame trading strategy involves using two different charts of varying durations for the same stock to identify trades. This helps traders confirm trends and make informed decisions based on both long-term and short-term price movements.

