- Offerings
- Tools & Platforms
Tools & Calculators
- Open API
- Calculators
- SIP Calculator
- CAGR Calculator
- Compound Interest Calculator
- FD Calculator
- RD Calculator
- EPF Calculator
- Retirement Calculator
- HDFC SIP Calculator
- Mutual Fund Return Calculator
- Lumpsum Calculator
- Step Up SIP Calculator
- ETF SIP Calculator
- Brokerage Calculator
- Equity Margin Calculator
- SWP Calculator
- EMI Calculator
- MTF Calculator
- Pricing
- SKY Learn
- Mutual Funds
- Margin Trading
- Financial Planning
- Personal Finance
- Share Trading
- IPO
- Derivatives
- Currencies
- Intraday Trading
- Trading Strategies
- Demat Account
- Commodity
- ETF
What is ABCD Pattern? Three Phases of ABCD Pattern
By HDFC SKY | Updated at: May 15, 2025 01:14 PM IST
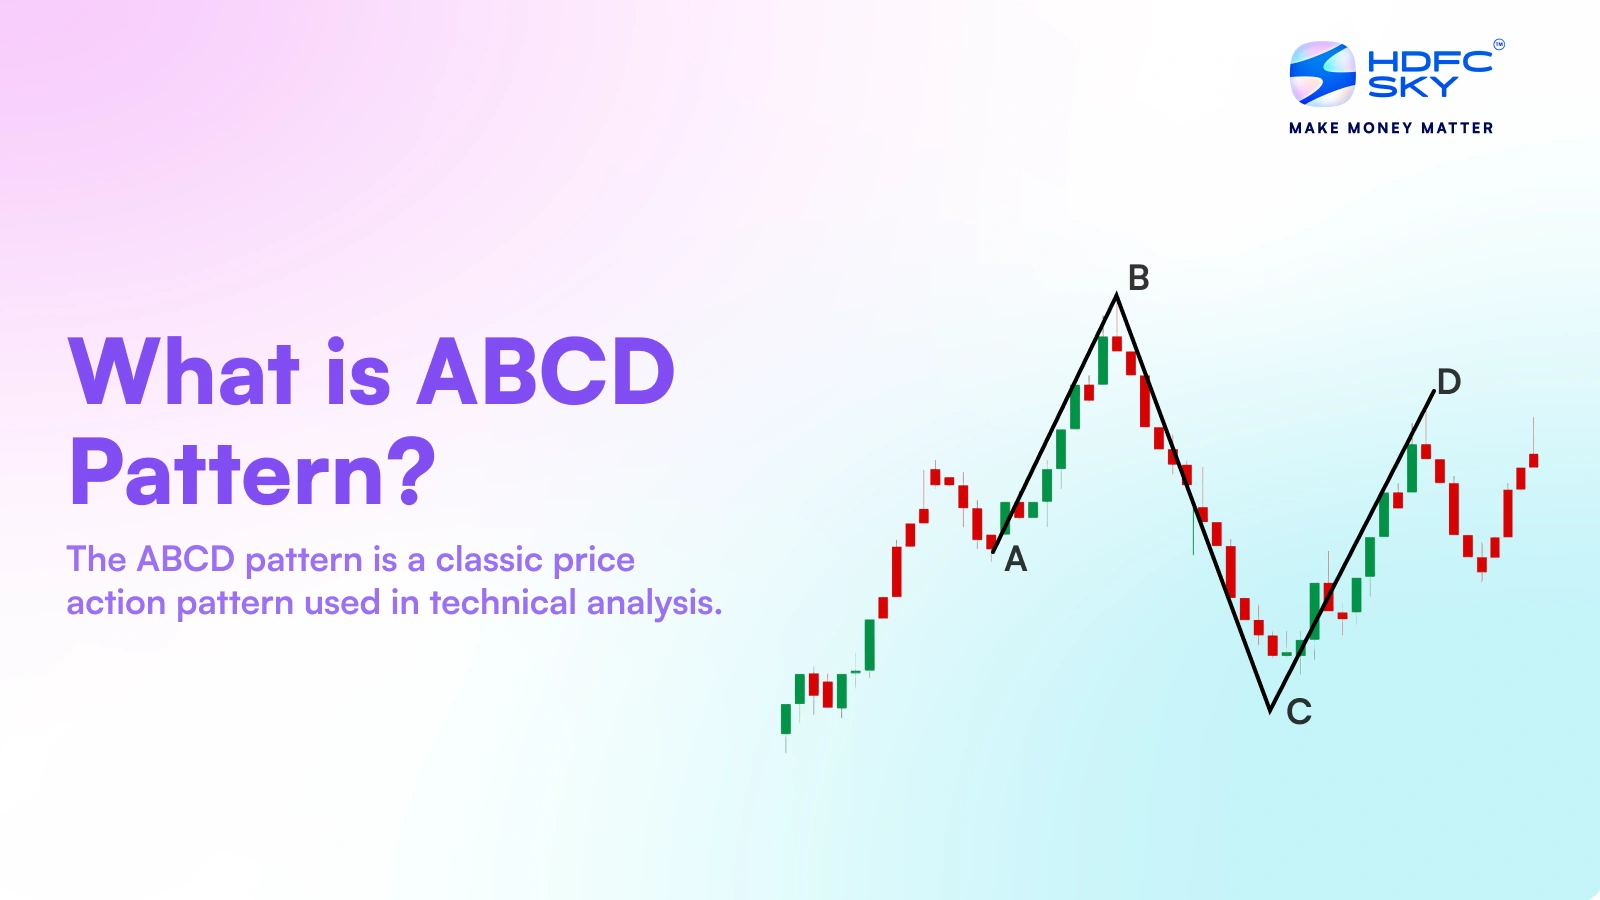
The ABCD pattern trading is a classic price action pattern used in technical analysis to identify potential trading opportunities in the stock market. It consists of four points (A, B, C, and D) that form a structured sequence on a price chart. This pattern helps traders anticipate market reversals and plan their trades accordingly.
What are the Rules of the ABCD Pattern?
The ABCD pattern trading follows specific rules to ensure accurate identification and trading execution:
Point A to Point B (A-B Leg)
A-B leg represents the initial price movement, which could be upward or downward. This leg is often driven by strong buying or selling momentum, establishing the first directional bias.
Point B to Point C (B-C Leg)
B-C leg is the corrective phase, during which the price retraces a portion of the A-B move. This retracement is usually weaker in volume and momentum than the first leg. The extent of retracement can often be predicted using Fibonacci ratios such as 38.2%, 50%, or 61.8%, which helps traders gauge the strength of the ongoing trend.
Point C to Point D (C-D Leg)
The C-D leg typically mirrors the A-B leg in length and magnitude. This move resumes the initial trend and confirms that the price structure follows the ABCD chart pattern. Traders usually look for this leg to complete at a level, where a price reversal may occur.
Point D
This marks the completion of the pattern and the potential reversal point. If the ABCD chart pattern is bullish, traders expect a price increase after point D. If it’s bearish, the price is likely to decline after reaching this level.
Importance of the ABCD Pattern
The ABCD pattern trading is a powerful tool for several reasons:
- Predictability: It provides a structured approach to identifying potential trade setups, making it easier for traders to anticipate price movements.
- Versatility: The pattern applies across different financial markets, including stocks, forex, and commodity market.
- Risk Management: By identifying clear entry and exit points, traders can establish well-defined stop-loss and take-profit levels, thereby managing risk effectively.
- Easy to Spot: Once traders are familiar with its structure, the pattern becomes easier to identify in real-time market conditions, making it a practical addition to a trader’s strategy.
Three Phases of the ABCD Pattern
The ABCD pattern trading unfolds in three key phases:
A-B Leg
The first move in the ABCD pattern establishes the initial price trend. If the price rises from point A to point B, it indicates a bullish move, while a drop suggests a bearish trend. This leg often forms with strong momentum, making it easily recognisable.
B-C Leg
This phase represents a price correction, typically retracing a portion of the A-B leg. The retracement levels commonly align with Fibonacci ratios such as 38.2%, 50%, or 61.8% of the initial move. This is where traders look for confirmation before proceeding.
C-D Leg
The final leg mirrors the A-B movement and signals a continuation of the original trend. The price moves in the same direction as the A-B leg, forming the last part of the pattern and leading to point D, where a reversal is expected.
Note that Point D marks the completion of the ABCD pattern and serves as the potential reversal point. Traders often place buy or sell orders at this level, depending on whether the pattern is bullish or bearish. The alignment of Fibonacci levels and volume analysis can provide additional confirmation.
Bearish ABCD Pattern
In ABCD Pattern Trading, the bearish version signals a potential downtrend in the market.
It starts with a sharp downward move from point A to point B, indicating a strong bearish sentiment. This is followed by a corrective upward retracement from point B to point C, where traders often misinterpret the trend as reversing.
However, the final C-D leg resumes the initial downward momentum, confirming that the bearish trend remains intact. Traders pay close attention to point D, as it often marks the completion of the pattern and a potential entry for short-selling.
At this stage, additional confirmation tools such as volume analysis and relative strength index (RSI) indicators can be used to validate the trade. Understanding this pattern helps traders avoid common pitfalls, such as mistaking the B-C retracement for an actual reversal.
ABCD Pattern Trading Strategies
Traders employ various ABCD pattern trading strategies to effectively trade in the stock market. Some important pointers that you must keep in mind if you want to trade using ABCD pattern trading are as follows:
- Entry Strategy: When the pattern completes and price action confirms a reversal, traders can enter trades at point D. Before making a move, traders should monitor volume and momentum indicators for additional validation.
- Stop-Loss Placement: Set stop-loss orders slightly beyond point D to minimise risk. Placing stop-losses too close might result in premature exits, so traders often use ATR (Average True Range) to determine appropriate stop-loss levels.
- Profit Targets: Determine exit points using previous support or resistance levels and Fibonacci extensions. The typical profit target is an extension of the A-B leg, but traders may also consider partial profit booking along the way.
- Confirmation Tools: To strengthen trade decisions, traders use additional technical indicators such as RSI, MACD, or volume analysis. They also examine trendline support and resistance zones to improve accuracy.
- Multiple Time Frame Analysis: The ABCD pattern can be confirmed by analysing higher time frames. For example, if the pattern is forming on a 15-minute chart, checking the 1-hour or daily chart can help validate the trend direction.
Example of Trades Using the ABCD Pattern
We will now discuss ABCD pattern examples of both bullish & bearish nature.
Example 1: Bullish ABCD Pattern
A stock moves from Rs. 100 (Point A) to Rs. 120 (Point B), retracing to Rs. 110 (Point C) before surging back to Rs. 130 (Point D). A trader enters this stock at point D with a stop-loss below it and exits at Rs. 140.
Example 2: Bearish ABCD Pattern
A stock drops from Rs. 200 (Point A) to Rs. 180 (Point B), then retraces to Rs. 190 (Point C) before declining to Rs. 170 (Point D). A trader short-sells at point D and exits at Rs. 160.
Conclusion
The ABCD pattern trading is an essential tool in technical trading, providing clear trade setups based on price action. By understanding its structure, rules, and application, traders can leverage ABCD Pattern Trading to make informed decisions and manage risk effectively. The ABCD pattern offers opportunities across various time frames and market conditions, whether bullish or bearish.
Related Articles
FAQs on What is ABCD Pattern?
How does the bullish ABCD pattern work?
The bullish ABCD pattern occurs when a B-C retracement and a C-D continuation move upwards follow an upward A-B leg. Traders enter at point D, anticipating further gains.
How do you identify an ABCD pattern?
Traders identify the ABCD pattern by spotting three price movements: a strong initial move, a retracement, and a continuation mirroring the first move. Fibonacci levels help confirm its validity.
Are there any tools or software that can assist in identifying and trading the ABCD pattern?
Yes, charting software such as TradingView, MetaTrader, and ThinkorSwim offer built-in pattern recognition tools and Fibonacci retracement indicators to help traders identify the ABCD pattern.
Can the ABCD Pattern be used in all time frames for trading?
Yes, the ABCD pattern works across different time frames, including intraday, swing trading, and long-term investing. Traders choose time frames based on their trading style and goals.
How do traders use the ABCD Pattern for setting profit targets?
Traders determine profit targets using Fibonacci extensions and previous support or resistance levels. Many traders aim for an extension of the A-B leg, ensuring they follow a risk-reward ratio that aligns with their strategy.
How do you trade the ABCD Pattern for a reversal strategy?
To trade the ABCD pattern for a reversal, traders wait for the pattern to complete at point D and confirm a trend change with additional indicators like RSI or MACD. Entry is taken once a reversal signal appears, aiming for a move in the opposite direction.
How do stop-loss strategies work with the ABCD Pattern?
Stop-loss strategies for the ABCD pattern involve placing stop-loss orders slightly beyond point D. This protects against false breakouts while giving the trade room to develop. Traders often use ATR (Average True Range) to determine a suitable stop-loss distance.
What are some common mistakes traders make when using the ABCD Pattern?
Common mistakes include misidentifying pattern legs, ignoring key confirmation signals, overtrading, setting improper stop-loss levels, and failing to manage risk effectively. New traders often mistake the B-C retracement for a full reversal, leading to premature entries.

