- Offerings
- Tools & Platforms
Tools & Calculators
- Open API
- Calculators
- SIP Calculator
- CAGR Calculator
- Compound Interest Calculator
- FD Calculator
- RD Calculator
- EPF Calculator
- Retirement Calculator
- HDFC SIP Calculator
- Mutual Fund Return Calculator
- Lumpsum Calculator
- Step Up SIP Calculator
- ETF SIP Calculator
- Brokerage Calculator
- Equity Margin Calculator
- SWP Calculator
- EMI Calculator
- MTF Calculator
- Pricing
- SKY Learn
- Mutual Funds
- Margin Trading
- Financial Planning
- Personal Finance
- Share Trading
- IPO
- Derivatives
- Currencies
- Intraday Trading
- Trading Strategies
- Demat Account
- Commodity
- ETF
- What is Ascending Triangle Pattern?
- Characteristics of the Ascending Triangle Pattern
- What is the purpose of an Ascending Triangle Pattern?
- How Does an Ascending Triangle Pattern Form?
- Advantages of Ascending Triangle Chart Pattern
- Disadvantages of Ascending Triangle Chart Pattern
- How does Volume Affect the Ascending Triangle Pattern?
- How Does Ascending Triangle Pattern Help Traders?
- Difference Between Ascending and Descending Triangle Pattern
- Psychological Aspects of the Ascending Triangle Pattern
- How to Trade Using the Ascending Triangle Pattern in the Stock Market?
- Conclusion
- FAQs on What is Ascending Triangle Pattern?
What is Ascending Triangle Pattern & How Does an Ascending Triangle Pattern Form?
By HDFC SKY | Updated at: Nov 21, 2025 05:24 PM IST
The Ascending Triangle Pattern is a bullish continuation chart pattern often seen during uptrends. It forms when a horizontal resistance line meets a rising trendline, indicating that buyers are gradually gaining strength. Traders use this pattern to anticipate breakouts and plan long positions.
What is Ascending Triangle Pattern?
An ascending triangle chart pattern in trading is a consolidation pattern that forms when an upward price trend is still going on. The pattern features a flat upper resistance line and an ascending lower support line. This formation depicts strong buying pressure.
This breakout pattern emerges when the price makes equal highs but progressively higher lows. Technical analysts consider this a very robust bullish signal, especially in well-set uptrends. This pattern reflects accumulation by institutional investors, where buying pressure gradually overcomes selling resistance at a specific price level.
Characteristics of the Ascending Triangle Pattern
As a chart design, the pattern is easy to spot. It features a flat top along with rising bottom trend lines. It helps traders know that the upsurge in price movement is likely to continue.
- The price action should come from an extremely clear uptrend in price movement.
- The upper resistance line must be horizontal and connect at least two equal highs
- The lower trend line should slope upwards. This will connect lows that go progressively higher.
- The support level needs to be joined by at least two consecutive separated points. Also, the subsequent low needs to be higher than the previous one. A true pattern will emerge only in this scenario.
- Volume patterns often go down during formation but surge significantly during breakout in the triangle patterns in trading.
What is the purpose of an Ascending Triangle Pattern?
The purpose of an Ascending Triangle Pattern is to signal a potential bullish continuation in the market. It helps traders identify an opportunity for buying when the price breaks above the upper horizontal resistance line after making a series of higher lows. The pattern indicates that while the price is facing resistance at a certain level, buyers are gradually becoming stronger as they push the price higher with each new low. Essentially, the ascending triangle suggests that the market is accumulating strength and preparing for an upward breakout, making it an ideal setup for traders to enter long positions before the breakout occurs. The pattern is often used by technical analysts to forecast price movement and improve trading strategies, as the breakout from the triangle is seen as a signal of sustained bullish momentum.
How Does an Ascending Triangle Pattern Form?
As you track the market, you will notice ascending triangles form in a distinct sequence. The formation of an ascending triangle begins when a stock encounters a robust resistance level, with sellers consistently capping price increases. However, buyers remain optimistic, creating progressively higher lows.
Watch how the price bounces between these two forces. With each swing, buyers step in at higher levels while sellers remain fixed at the resistance. This creates a compression zone where price movement becomes increasingly confined.
Your chart clearly shows this battle between buyers and sellers. The horizontal resistance line at the top and an upward-sloping support line at the bottom tell the story. The formation often completes when buying pressure finally overwhelms the sellers at resistance.
Advantages of Ascending Triangle Chart Pattern
The Ascending Triangle chart pattern is favored by traders for its ability to signal strong bullish momentum. It helps identify potential breakouts, making it easier to time trades and manage risks effectively.
- Clear Breakout Indicator: The pattern’s horizontal resistance and rising support levels provide distinct breakout points.
- Supports Risk Management: Traders can place stop-loss orders below the rising trendline to limit losses.
- Confirms Bullish Trend: It often signals the continuation of an uptrend, increasing trading confidence.
- Volume Confirmation: Breakouts are usually accompanied by increased volume, validating the move.
- Applicable Across Timeframes: Useful for day trading to long-term investing.
- User-Friendly: Easy to spot and understand, suitable for traders of all experience levels.
Disadvantages of Ascending Triangle Chart Pattern
While useful, the Ascending Triangle pattern has its drawbacks and may not always guarantee successful trades.
- False Breakouts: Sometimes the price breaks the resistance but quickly reverses, causing losses.
- Requires Volume Confirmation: Without increased volume, breakouts may lack strength.
- Not Always Predictive: The pattern can fail in volatile or sideways markets.
- Delayed Signals: Traders might enter late after the breakout, reducing profit potential.
- Limited Bearish Insight: Primarily a bullish pattern, it offers little guidance during downtrends.
- Over-reliance Risk: Solely depending on this pattern without other indicators can be risky.
How does Volume Affect the Ascending Triangle Pattern?
Volume acts as a crucial confirmation tool when trading ascending triangles. During the pattern’s formation, you may typically observe declining volume as the price consolidates. This is normal.
Watch for a significant volume surge when the price breaks above the resistance level. This is your key validation signal. A breakout with high volume suggests strong and sustained buying interest. As a result, you can be fairly confident that the price surge is going to continue. But be aware of a low-volume breakout. It may be a false signal or weak momentum.
Example: Interpreting the Ascending Triangle Pattern
Let’s take a closer look at how to interpret an Ascending Triangle Pattern with a practical example:
Scenario: Imagine you are analysing a stock like XYZ Ltd. on a 4-hour chart. The price has been in an uptrend, and you’re noticing a formation of an ascending triangle pattern.
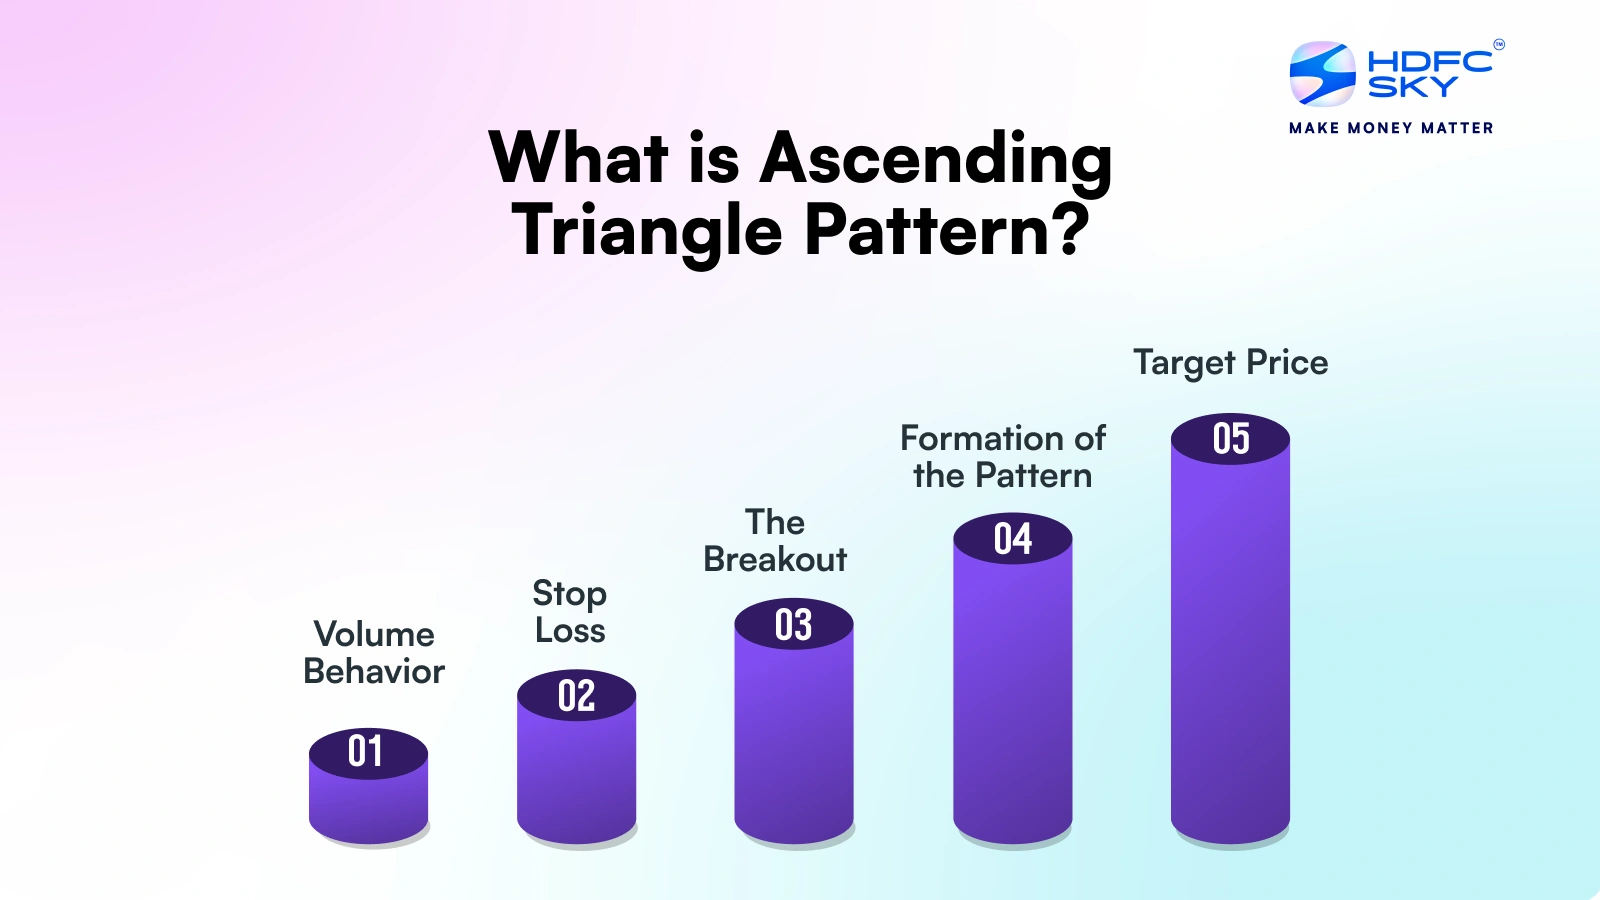
- Formation of the Pattern:
- Upper Resistance Line: The stock consistently hits the same price level (₹150) and fails to break above it, creating a horizontal resistance line at ₹150.
- Lower Support Line: Meanwhile, the stock continues to make higher lows, bouncing off around ₹140 and gradually rising. This creates an ascending support line.
- This action forms the triangle, with higher lows pushing against the same resistance level, indicating increasing buying pressure.
- Volume Behavior:
- During the pattern’s formation, volume typically decreases as the price consolidates between the support and resistance lines.
- The volume will surge significantly when the price breaks above the resistance line of ₹150, confirming that the breakout is backed by strong buying interest.
- The Breakout:
- As the stock price finally breaks above ₹150 with a spike in volume, it signals a potential bullish continuation. Traders who had identified the pattern might enter a long position just above ₹150, expecting the price to continue rising.
- Target Price:
- To calculate a price target from the breakout, measure the height of the triangle. If the triangle spans ₹10 (the difference between ₹140 and ₹150), you could estimate a price target by adding this distance to the breakout point of ₹150, resulting in a target of ₹160.
- Stop Loss:
- A stop loss can be placed just below the most recent higher low (around ₹145), allowing traders to manage risk if the breakout fails and the price returns to the support level.
How Does Ascending Triangle Pattern Help Traders?
The ascending triangle pattern helps traders by signaling a likely bullish breakout, offering clear entry and exit points based on price action and volume.
- Predicts Breakouts: Indicates strong buying interest and potential upward price movement.
- Defines Risk: Clear support and resistance levels help set stop-loss orders.
- Targets Profit: Provides measurable price targets using the triangle’s height.
- Improves Timing: Helps traders enter trades at optimal moments, minimising guesswork.
- Validates Trends: Confirms continuation of an uptrend, increasing trade confidence.
Difference Between Ascending and Descending Triangle Pattern
Both are continuation patterns but indicate opposite market sentiments. The ascending triangle is bullish, while the descending triangle is bearish.
| Feature | Ascending Triangle | Descending Triangle |
| Shape | Flat resistance line, rising support line | Flat support line, falling resistance line |
| Trend Indication | Bullish continuation pattern | Bearish continuation pattern |
| Breakout Direction | Breakout upwards (bullish) | Breakdown downwards (bearish) |
| Market Sentiment | Buying pressure increasing | Selling pressure increasing |
Psychological Aspects of the Ascending Triangle Pattern
The Ascending Triangle Pattern reflects the psychological battle between buyers and sellers in the market:
- Buying Pressure vs. Selling Resistance:
- Buyers are increasingly optimistic, creating higher lows, while sellers resist at a set price level, showing confidence in keeping prices down.
- Building Tension:
- As the pattern forms, anticipation builds, with both buyers and sellers waiting for the breakout, leading to psychological pressure.
- Breakout – The Decision Moment:
- When the price breaks above resistance, buyers feel confident, pushing the price higher, while sellers may cut losses, amplifying bullish momentum.
- False Breakouts:
- False breakouts can cause frustration and panic selling, making it important to confirm the breakout with additional indicators.
- Market Sentiment Shift:
- The breakout shifts market sentiment from mixed uncertainty to bullish optimism, fueling further buying activity.
Traders must manage emotions like fear and greed to navigate these psychological dynamics effectively.
How to Trade Using the Ascending Triangle Pattern in the Stock Market?
Trading the ascending triangle pattern involves identifying a breakout above resistance with strong volume. Proper entry, stop-loss, and target setting are key to success.
- Identify the Pattern: Spot a flat resistance line and rising support line forming the triangle.
- Wait for Breakout: Look for a clear breakout above resistance with increased volume.
- Enter the Trade: Buy when price closes above the resistance level.
- Set Stop-Loss: Place stop-loss below the last swing low or support line.
- Determine Target: Measure the triangle’s height and project it upwards for the target price.
- Monitor Volume: Ensure volume supports the breakout to reduce false signals.
- Exit Strategy: Book profits at the target or if reversal signs appear.
Conclusion
The ascending triangle pattern is a common pattern that traders use when trading various assets. This post helps explain the ascending triangle chart pattern. You should now understand how to identify and utilise the ascending triangle pattern effectively in your trading strategies. Remember that this pattern is not 100% accurate every time you spot it on a chart. It is wise to confirm the signal with other candlesticks and technical indicators before making a decision.
Related Articles
FAQs on What is Ascending Triangle Pattern?
Is the ascending triangle bullish in nature?
Yes, the ascending triangle is inherently bullish. It typically forms a continuation pattern during uptrends. The pattern shows increasing buying pressure through higher lows, while sellers remain consistent at resistance. When trading stocks, this formation often signals strong institutional buying interest.
How many kinds of triangle pattern charts are there?
In technical analysis, you will see three main types of triangle patterns: ascending, descending, and symmetrical triangles. Each has distinct characteristics and trading implications. Triangle patterns can form across all trading timeframes.
How to identify ascending triangle patterns?
The pattern features a flat upper resistance line and an ascending lower support line. Ideally, the price action will compress as the pattern develops. This formation depicts strong buying pressure.

