- Offerings
- Tools & Platforms
Tools & Calculators
- Open API
- Calculators
- SIP Calculator
- CAGR Calculator
- Compound Interest Calculator
- FD Calculator
- RD Calculator
- EPF Calculator
- Retirement Calculator
- HDFC SIP Calculator
- Mutual Fund Return Calculator
- Lumpsum Calculator
- Step Up SIP Calculator
- ETF SIP Calculator
- Brokerage Calculator
- Equity Margin Calculator
- SWP Calculator
- EMI Calculator
- MTF Calculator
- Pricing
- SKY Learn
- Mutual Funds
- Margin Trading
- Financial Planning
- Personal Finance
- Share Trading
- IPO
- Derivatives
- Currencies
- Intraday Trading
- Trading Strategies
- Demat Account
- Commodity
- ETF
- Understanding Commodity Channel Index (CCI)?
- How to Calculate the Commodity Channel Index – Formula & Example
- How Does the Commodity Channel Index (CCI) Work?
- What are the Advantages and Disadvantages of CCI?
- How Do Traders Use the Commodity Channel Index (CCI)?
- The Commodity Channel Index vs. The Stochastic Oscillator
- Conclusion
- FAQs on What is Commodity Channel Index (CCI)?
What is Commodity Channel Index (CCI)?
By HDFC SKY | Updated at: Jul 24, 2025 01:38 PM IST
Summary
- Commodity Channel Index (CCI) is a technical indicator developed by Donald Lambert to identify cyclical trends in commodity markets but is now widely used across asset classes.
- CCI measures the difference between an asset’s current price and its historical average price, helping traders identify overbought or oversold conditions.
- Calculation formula:
CCI = (Typical Price – SMA) / (0.015 × Mean Deviation)
where Typical Price = (High + Low + Close) / 3. - Signal interpretation:
- CCI above +100 indicates overbought conditions – potential sell signal.
- CCI below -100 suggests oversold conditions – potential buy signal.
- Widely used in combination with other indicators to confirm entry/exit points rather than in isolation.
- Advantages include identifying price reversals and trend strength; limitations involve false signals during volatile or sideways markets.
- CCI is especially popular among short-term traders and technical analysts for spotting momentum shifts.
The Commodity Channel Index (CCI) was developed and introduced by Donald Lambert in 1980. The Commodity Channel Index (CCI) is a versatile momentum oscillator* used in technical analysis across financial markets like commodities, stocks, and forex. Its main function is to identify cyclical trends, highlight potential price reversals, gauge trend strength, and signal overbought or oversold conditions.
*A versatile momentum oscillator is a technical analysis tool that measures the speed and strength of price changes and can be used to identify trend direction, overbought/oversold conditions, and potential price reversals across timeframes.
Understanding Commodity Channel Index (CCI)?
The Commodity Channel Index (CCI) measures the difference between an asset’s current price and its historical average price over a specific period. It quantifies the variation of a security’s price from its statistical mean. The CCI reading is high when current prices are significantly above their average.
When prices are substantially below their average, the CCI reading is low. This allows traders to identify potential overbought/oversold levels. As the name indicates, the CCI was originally designed for commodities but is now applied across most financial markets.
How to Calculate the Commodity Channel Index – Formula & Example
The CCI indicator is calculated using the following formula:
CCI = (Typical Price – Simple Moving Average) / (0.015 × Mean Deviation)
Where:
- Typical price (TP) = (High + Low + Close) / 3
- A simple moving average (SMA) is calculated over a specified period (typically 20 periods).
- Mean deviation is the average of the absolute differences between the typical Price and the SMA over the same period (TP-SMA)/number of periods.
- Constant (0.015): Lambert included this constant so that approximately 70-80% of CCI values fall within the +100 to -100 range for readability and standardised analysis. Shorter periods result in more volatility and fewer values within ±100.
Let’s calculate the Commodity Channel Index for a hypothetical stock price. Assuming today is day 21, we are calculating for 20 days.
High Price = ₹105.00
Low Price = ₹100.00
Closing Price = ₹103.00
Period for SMA = 20 days
1. Calculate the Typical Price (TP):
TP = (High Price + Low Price + Closing Price) / 3
TP = (105 + 100 +103)/3 = ₹102.67
2. Assume the SMA was ₹98 (this is hypothetical and has to be calculated over the previous 20 days).
3. Assume the mean deviation was ₹2.50 (this is hypothetical and has to be calculated over the previous 20 days).
4. Calculate CCI:
CCI = (TP – SMA) / (0.015 × Mean Deviation)
CCI = (102.67-98) / (0.015 × 2.50)
CCI = 4.67 / 0.035 = 124.53
So, the CCI for the given stock is approximately 124.53. The value is over +100. This could indicate an overbought situation or a strong uptrend, as per the CCI.
How Does the Commodity Channel Index (CCI) Work?
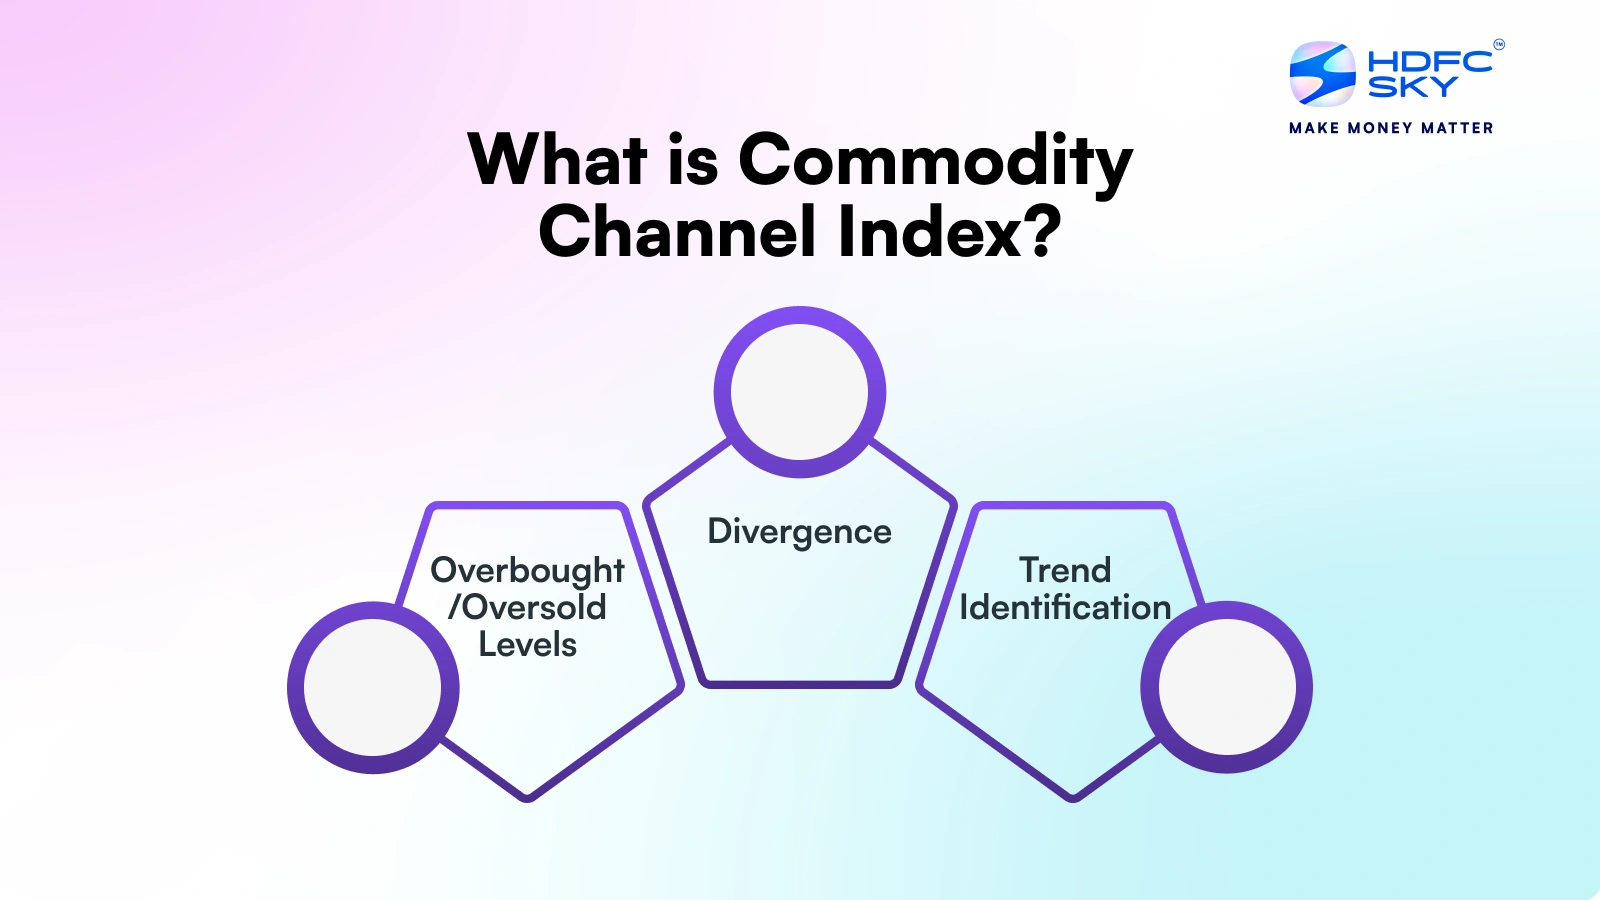
The Commodity Channel Index oscillates around a zero line. The CCI indicator helps with the following:
- Trend Identification: Movements over +100 could mean a strong uptrend (buy signal), while movements below -100 could suggest a strong downtrend (sell signal).
- Overbought/Oversold Levels: Readings above +100 could mean overbought conditions, while readings below -100 could mean oversold conditions. Please remember that the CCI doesn’t have upper or lower limits (it’s an unbound oscillator). One should be extremely cautious while interpreting its levels. Keep volatility in mind during interpretation. Use confirmations from other technical analysis tools, too.
- Divergence: Divergence is when the asset’s price and the CCI indicator move in opposite directions. It could mean a weakening trend and a sign of a reversal on the cards. A Bullish Divergence is when prices make new lows but the CCI fails to make corresponding new lows (making higher lows instead). This suggests falling downward momentum. A Bearish Divergence is when prices make new highs, but the CCI fails to reach corresponding new highs (making lower highs instead). This indicates weakening upward momentum.
What are the Advantages and Disadvantages of CCI?
Advantages of Using the CCI Indicator in Trading:
Here are some of the advantages of using the CCI indicator in trading:
- Overbought/Oversold Levels: The CCI measures price deviation from its average, helping traders identify overbought conditions above +100 and oversold conditions below -100. These levels indicate potential reversal zones.
- Trend Identification: A rising CCI suggests bullish momentum, while a declining CCI indicates bearish sentiment.
- Divergence Detection: Traders use commodity channel indicators to detect bullish and bearish divergences, often preceding trend reversals.
- Versatility: The Commodity Channel Index Indicator can be adapted across multiple timeframes and markets.
- Multiple Trading Strategies: The Commodity Channel Index Indicator is often combined with moving averages, support/resistance, or volume analysis to improve trade accuracy.
- Algorithmic Trading: The Commodity Channel Index Indicator formula is straightforward, which makes it simple to integrate into automated trading systems.
Disadvantages of Using the CCI Indicator in Trading:
- False Signals: The Commodity Channel Index Indicator may generate misleading signals, especially in sideways markets, leading to premature entries and exits.
- Lagging Indicator: As a momentum oscillator, the CCI reacts to past price action, which may delay optimal entry and exit points.
- Complex Interpretation: The formula considers typical price and SMA, making it difficult for novice traders to use effectively.
- Market Noise Sensitivity: The CCI responds to short-term fluctuations, making trends harder to interpret in volatile conditions.
- Limited Predictive Power: While the commodity channel indicator highlights overbought/oversold zones, it does not indicate the duration or strength of trend reversals.
How Do Traders Use the Commodity Channel Index (CCI)?
Traders use any of the below commodity channel index strategies to trade in markets:
- Overbought/Oversold Reversals: When the CCI indicator line crosses above +100, it signals an overbought condition, suggesting a potential sell opportunity. Conversely, a cross below -100 indicates an oversold condition, signalling a potential buy.
- Zero-Line Crossovers: Crossing above zero is bullish while crossing below is bearish.
- Divergence: As discussed earlier, traders can identify bullish and bearish divergences as signals for trend reversals.
- Trend Following: Traders may enter long positions when CCI crosses +100 and may sell when it crosses -100.
Combining CCI with other indicators, like RSI or MACD, and price action (e.g., candlestick patterns) enhances reliability.
The Commodity Channel Index vs. The Stochastic Oscillator
The Commodity Channel Index (CCI) and the Stochastic Oscillator are momentum indicators, but are calculated differently. CCI measures how far the price deviates from its average.
The Stochastic Oscillator compares the closing price to a price range over a period, making it more effective for spotting overbought and oversold conditions in sideways markets.
The following table shows the difference between the indicators:
| Factor | Commodity Channel Index (CCI) | Stochastic Oscillator |
| Purpose | Measures price deviation from its average | Compares the closing price to a high/low range over a specific period |
| Calculation | (Typical Price – SMA) / (0.015 × Mean Deviation) | %K = (Current Close – Lowest Low) / (Highest High – Lowest Low) × 100 |
| Range | No fixed range can exceed ±100 | Moves between 0 and 100 |
| Overbought/Oversold Levels | ±100 (above 100 is overbought, below -100 is oversold) | Above 80 is overbought, and below 20 is oversold |
| Best Used For | Identifying cyclical trends | Spotting overbought and oversold conditions |
| Market Type | Works well in trending markets | Works better in sideways markets |
While both indicators help traders analyse price momentum, CCI is trend-focused, whereas Stochastic is more suitable for range-bound markets.
Conclusion
CCI is a momentum oscillator indicator that spots overbought/oversold levels or trend reversals. While effective, particularly in trending markets, its signals are most reliable when confirmed by other technical indicators or price analysis methods to reduce the risk of false signals.
Related Articles
FAQs on What is Commodity Channel Index (CCI)?
Which is better, CCI or RSI?
Both CCI and RSI are momentum indicators, but the CCI is more versatile as it can also measure trends, while RSI mainly indicates overbought or oversold conditions. Traders often use both in conjunction for confirmation and better trade decisions.
How do you read the CCI indicator?
The CCI measures price deviations from its average, with values above +100 indicating overbought conditions and below -100 indicating oversold conditions. Readings near 0 suggest neutral market conditions. Traders use these levels to gauge potential trend reversals or continuation.
How can traders use the CCI to trade different markets?
Traders use the CCI to spot trend reversals in all markets by identifying overbought or oversold conditions. In trending markets, the CCI helps confirm the strength of a trend, while in range-bound markets, it signals potential entry points when the indicator crosses extreme levels.
How do I buy a commodity index?
Investors can purchase exchange-traded funds (ETFs) or mutual funds that track the index to buy a commodity index. These funds represent a basket of commodities, providing exposure to the price movements of various commodities like oil, gold, or agricultural products.
Who developed the CCI?
The Commodity Channel Index (CCI) was developed by Donald Lambert in 1980. It was originally designed to identify cyclical trends in commodities but is now used in various markets, including stocks and forex, to spot overbought or oversold conditions.
How is the Commodity Channel Index (CCI) used in Technical Analysis?
CCI is used to identify cyclical trends, overbought or oversold levels, and potential buy or sell signals. When combined with other indicators like moving averages or RSI, it helps traders spot market extremes and trend reversals and confirm the strength of a trend.
What trading strategies are used with the Commodity Channel Index (CCI)?
Common strategies with CCI include trend-following, where traders buy when the CCI crosses above +100 and sell when it crosses below -100, and divergence, where traders look for price movements opposite to the CCI, indicating potential trend reversals or continuation.
How effective is the Commodity Channel Index (CCI)?
CCI can effectively identify overbought or oversold conditions and spot trends, but its accuracy depends on market conditions. It is more reliable when combined with other technical indicators or confirmation from price action to avoid false signals.
How does CCI work in conjunction with other Indicators?
CCI works well with other indicators like RSI, moving averages, and MACD to confirm buy or sell signals. For instance, combining CCI’s overbought or oversold signals with an RSI confirmation or moving average cross enhances the reliability of trade decisions.
What are some CCI mistakes traders make?
Common mistakes include relying solely on CCI without confirming signals from other indicators, trading based on extreme CCI values without considering market context, and failing to adjust settings for different time frames or market conditions, leading to false signals.
Is the Commodity Channel Index (CCI) accurate?
The CCI is a valuable tool, but its accuracy can vary based on market conditions and settings. It works best in trending markets but may produce false signals in choppy or sideways markets. Traders should combine it with other indicators for higher accuracy.

