- Offerings
- Tools & Platforms
Tools & Calculators
- Open API
- Calculators
- SIP Calculator
- CAGR Calculator
- Compound Interest Calculator
- FD Calculator
- RD Calculator
- EPF Calculator
- Retirement Calculator
- HDFC SIP Calculator
- Mutual Fund Return Calculator
- Lumpsum Calculator
- Step Up SIP Calculator
- ETF SIP Calculator
- Brokerage Calculator
- Equity Margin Calculator
- SWP Calculator
- EMI Calculator
- MTF Calculator
- Pricing
- SKY Learn
- Mutual Funds
- Margin Trading
- Financial Planning
- Personal Finance
- Share Trading
- IPO
- Derivatives
- Currencies
- Intraday Trading
- Trading Strategies
- Demat Account
- Commodity
- ETF
What is Ichimoku Cloud? - Meaning, Calculation & How it Works?
By HDFC SKY | Updated at: Jul 24, 2025 06:30 PM IST
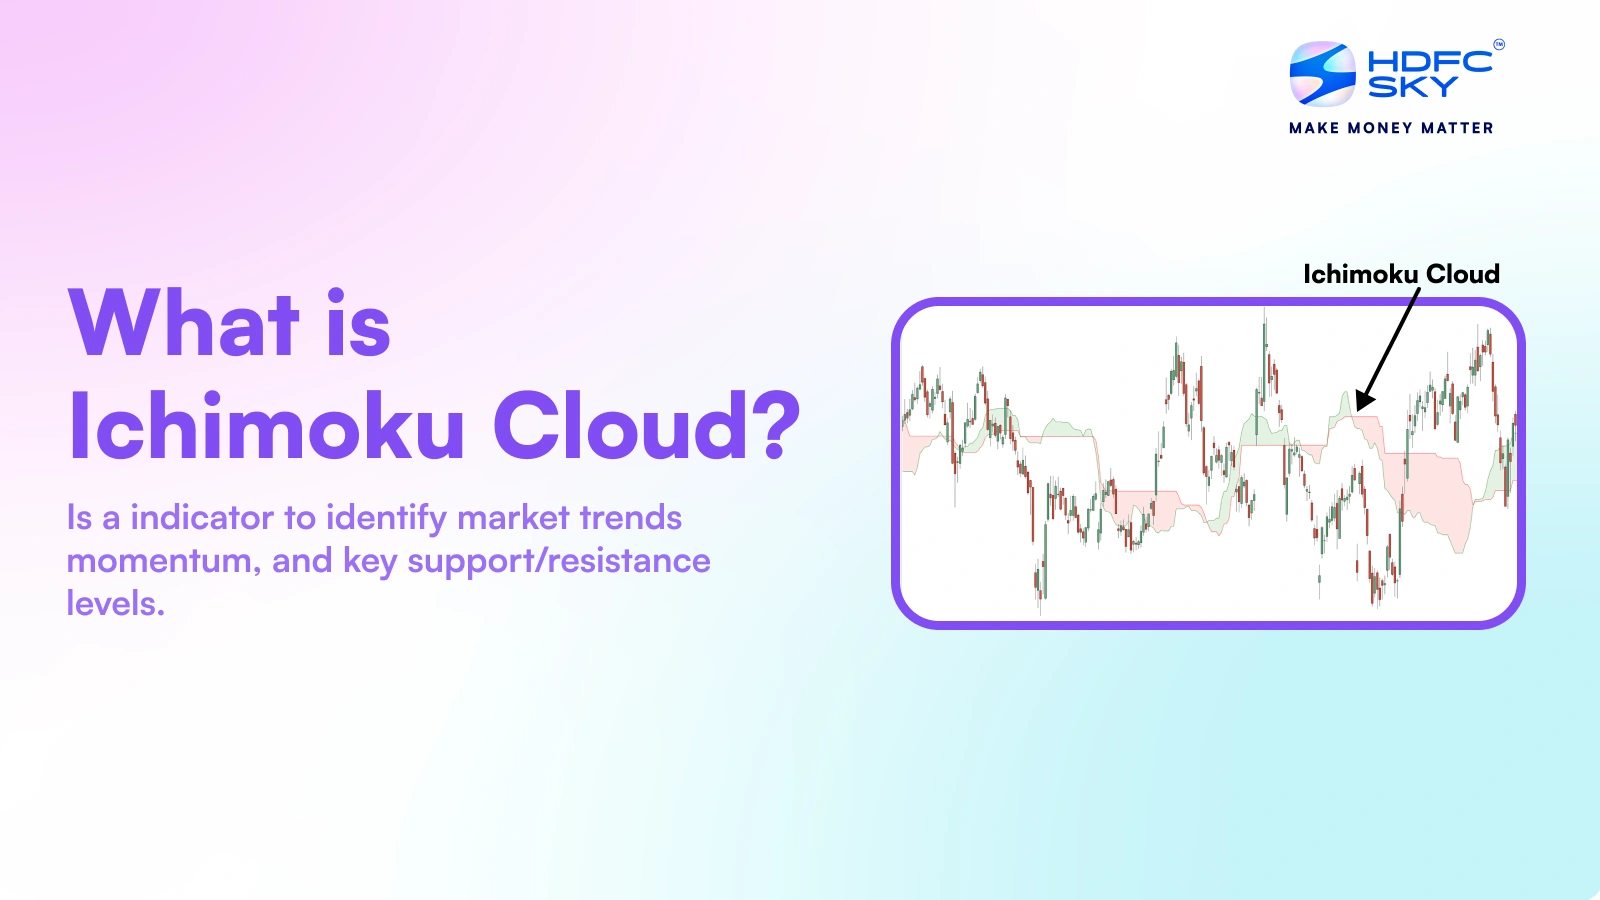
- Ichimoku Cloud, also known as Ichimoku Kinko Hyo, is a Japanese charting technique offering a comprehensive view of market trends, momentum, and support/resistance levels in a single glance.
- It consists of five key components:
- Tenkan-sen (Conversion Line) – Short-term trend indicator.
- Kijun-sen (Base Line) – Medium-term trend confirmation.
- Senkou Span A & B (Leading Spans) – Together form the “Cloud” (Kumo), projecting future support/resistance.
- Chikou Span (Lagging Span) – Indicates momentum by comparing current and past prices.
- Trading signalsemerge from:
- Price position relative to the Cloud (above = bullish, below = bearish).
- Crossovers between Tenkan-sen and Kijun-sen.
- Cloud twist patterns and thickness indicate trend strength or reversal.
- Highly favored for its visual clarity and suitability in trending markets.
- It is commonly used with other indicators for enhanced confirmation.
Numerous technical indicators are available for market analysis, with Moving Averages (MAs) being among the most popular among traders. However, some technical indicators remain off the radar, giving traders a potential edge due to their under utilisation. One such impactful, often overlooked indicator is the Ichimoku Cloud, which is an all in one indicator known for its ichimoku cloud indicator accuracy.
In this blog, you will learn about the Ichimoku Cloud technical indicator, how to use it for trading, and its limitations. Let’s get started.
What is Ichimoku Cloud Indicator?
Goichi Hosoda, a financial journalist in Japan, developed the Ichimoku Cloud. In the late 1960s, the research was published, and the final version was known as the Ichimoku Kinko Hyo. In Japanese, Ichimoku Kinko Hyo means ‘one-look equilibrium chart’. The Ichimoku Cloud is a versatile indicator that allows traders to identify market trends, momentum, and key support/resistance levels, with remarkable ichimoku cloud indicator accuracy in trending markets.
It comprises five lines and a shaded area called the “cloud.” If the price is above the cloud, it suggests an uptrend; below the cloud, a downtrend; and inside the cloud, the market is uncertain or consolidating.
The cloud’s thickness indicates market volatility thicker clouds mean more volatility. Crosses between two of its lines (Tenkan-Sen and Kijun-Sen) can signal potential buy or sell opportunities, making it a comprehensive tool for traders to analyse price action with just one look.
How to Calculate the Ichimoku Cloud?
To properly understand how the Ichimoku Cloud indicator functions, let’s now understand the formula behind it and factors affecting its ichimoku cloud indicator accuracy.
The formula for Ichimoku Cloud
The Ichimoku Cloud consists of five line indicators, each with its own formula. Some are lagging, and some are leading.
- Tenkan-Sen (Conversion Line):
This Tenkan-Sen line tells us about the key support and resistance levels on the chart, as well as a signal line for reversals. It takes into consideration the average of the highest high and lowest low of 9 previous periods.
Tenkan-Sen = (Highest High over last 9 periods + Lowest Low over last 9 periods)/2
- Kijun-Sen (Base Line):
The Kijun-Sen acts as a longer-term trend indicator and provides key levels of support and resistance. It’s calculated using the average of the highest high and lowest low over the past 26 periods, making it less sensitive than the Tenkan-Sen. A price above the Kijun-Sen suggests an uptrend, while a price below it signals a downtrend.
Kijun-Sen = (Highest High over last 26 periods + Lowest Low over last 26 periods)/2
- Senkou Span A (Leading Span A: Plotted 26 periods ahead):
Senkou Span A represents the midpoint between the Tenkan-Sen and Kijun-Sen. This line is plotted 26 periods ahead, helping traders anticipate future support and resistance levels. It plays a key role in forming the Ichimoku Cloud (Kumo) and can signal potential changes in trend direction when the price crosses above or below it.
Senkou Span A = (Tenkan-Sen + Kijun-Sen)/2
- Senkou Span B (Leading Span B: Plotted 26 periods ahead):
Senkou Span B is the midpoint between the highest high and lowest low over the last 52 periods. It is also plotted 26 periods ahead of the current price, creating the second boundary of the Ichimoku Cloud. It provides long-term support and resistance levels. The distance between Senkou Span A and Senkou Span B helps gauge the current trend’s strength.
Senkou Span B = Highest High over last 52 periods + Lowest Low over last 52 periods/2
- Chikou Span (Lagging Span: Plotted 26 periods behind):
The Chikou Span is the lagging line of the Ichimoku Cloud, plotted 26 periods behind the current closing price. It is used to confirm trends. If the Chikou Span is above the price from 26 periods ago, it confirms an uptrend, while if it is below, it suggests a downtrend. The Chikou Span helps traders visualize the relationship between current price action and historical price action.
Chikou Span = Current Closing Price
Chikou Span = Current Closing Price
(Note: In the Ichimoku Cloud formula there are three important numerical periods used: 9, 26, and 52. You must keep them in mind to understand and remember the formula better)
Example for Ichimoku Cloud
Below is an example for Ichimoku Cloud based on the formulas we discussed earlier
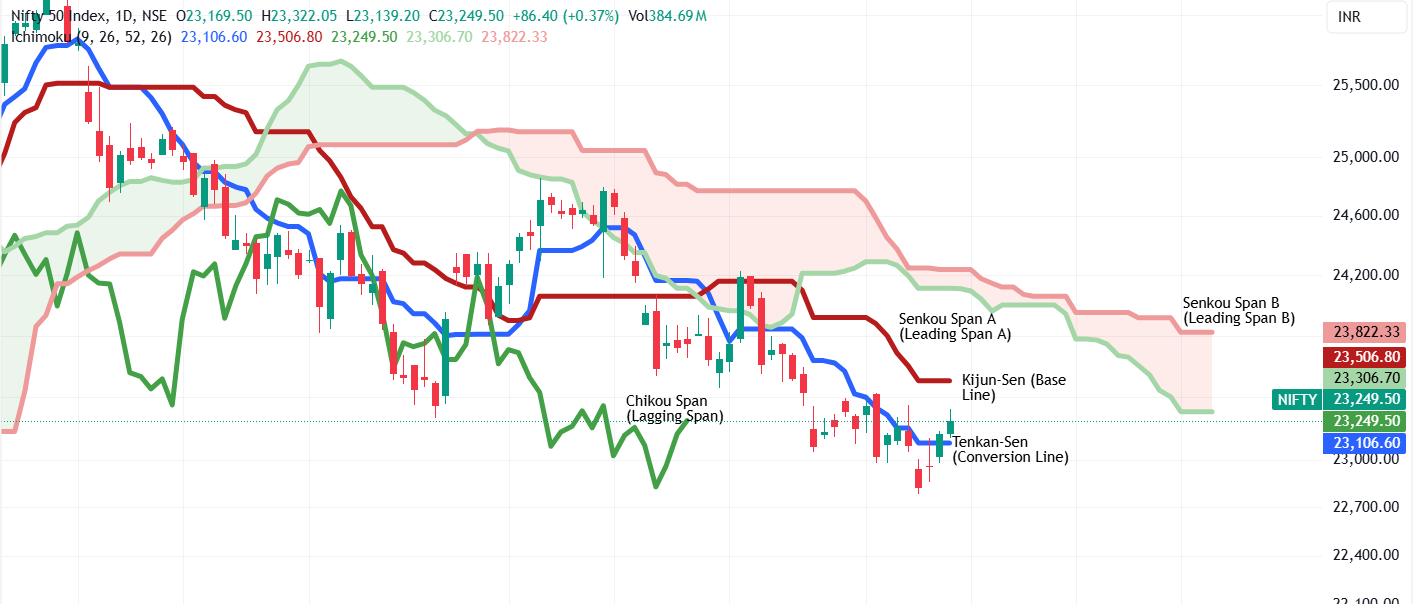
In the chart above:
- The Green line is Chikou Span (Lagging Span) plotted 26 periods behind.
- The Turquoise coloured line is Tenkan-Sen (Conversion Line).
- The Kijun-Sen (Base Line) is the maroon-coloured line.
- The Senkou Span A (Leading Span A) is in light green, plotted 26 periods forward.
- The Senkou Span B (Leading Span B) is plotted in light red and plotted 26 periods ahead.
The area between Senkou Span A and Senkou Span B is known as the “cloud” (Kumo), which helps spot potential resistance and support levels.
What Does the Ichimoku Cloud Tell You?
Ichimoku Cloud helps traders analyse price action in just one look. Here is how the Ichimoku Cloud is interpreted and works, reflecting on it’s typical ichimoku cloud indicator accuracy in identifying trends:
Trend Identification
- Bullish Trend: Price is above the cloud, and the cloud itself is green (Senkou Span A > Senkou Span B).
- Bearish Trend: Price is below the cloud, and the cloud is red (Senkou Span A < Senkou Span B).
- Neutral/Consolidation: Price is within the cloud, indicating a lack of clear trend.
Support and Resistance
The cloud acts as dynamic support and resistance. In a bullish trend, the cloud provides support, while in a bearish trend, it acts as resistance.
Momentum Interpretation
The relationship between the Tenkan-Sen and Kijun-Sen indicates momentum. A bullish crossover (Tenkan-Sen above Kijun-Sen) suggests increasing momentum, while a bearish crossover (Tenkan-Sen below Kijun-Sen) indicates decreasing momentum.
Trading Signals
- Buy Signal: When the price crosses above the cloud or the Tenkan-Sen crosses above the Kijun-Sen while the price is above the cloud.
- Sell Signal: When the price crosses below the cloud or the Tenkan-Sen crosses below the Kijun-Sen while the price is below the cloud.
Confirmation with Chikou Span
The Chikou Span can confirm trends by showing whether the current price is above or below the past price. A bullish confirmation occurs when the Chikou Span is above the price 26 periods ago, and a bearish confirmation occurs when it is below.
The Ichimoku Cloud can be applied to various timeframes. Day traders can use it on an intraday chart ranging from minutes to hours, while positional and swing traders can apply it daily. Because of all the above qualities of Ichimoku Indicator it is considered as an all-in-one indicator that helps determine trend direction, support and resistance levels, and trading signals. Overall, it provides a complete view at a glance.
How to Trade Using Ichimoku Cloud Strategy?
We will now consider a Bullish Trade Setup and provide you a step by step guide to give you an idea on how Ichimoku works, for confirming a bearish trend you can just reverse the criteria and take the trade accordingly.
- Start by identifying the trend: When the price is above the Ichimoku Cloud, and the cloud is green, i.e., Senkou Span A > Senkou Span B, it indicates the trend is bullish.
- Spotting Entry Signals: When Tenkan-sen (Conversion Line) crosses above the Kijun-sen (Base Line), indicating a potential bullish entry. The Chikou Span (Lagging Span) is above the price, confirming bullish momentum.
- Role of Cloud: The cloud acts as support. For instance, the price pulled back to the top of the cloud but did not break below it, showing strength in the trend.
- Initiating the trade: Traders initiate a long position when the price bounces off the cloud and moves higher.
- Setting a stop loss: A stop loss case should be placed just below the cloud to protect against a trend reversal.
Limitations of Using the Ichimoku Cloud Strategy
Ichimoku Cloud, despite being just one look indicator, has certain limitations. Here are the limitations of Ichimoku Cloud which you must keep in mind if you are planning to use it for trading and want to understand it’s ichimoku cloud indicator accuracy:
- Complex for Beginners: As the Ichimoku cloud indicator has multiple lines, it can be overwhelming and complex for a beginner.
- False Signals: Like other technical indicators, the Ichimoku Cloud can produce false signals, particularly in a non-trending or choppy market. Traders may witness whipsaws, where prices frequently cross above and below the cloud, leading to confusion.
- Not effective for Short-term trading: The Ichimoku Cloud is better suited for medium-to-long-term trading due to its emphasis on historical data and slower-moving components.
Conclusion
This blog provides a complete insight into the Ichimoku, which can give traders an edge. After understanding the Ichimoku trading strategy, you can effectively utilize it in trending markets. However, Ichimoku signals should not be used in isolation, and you can combine them with oscillators and other technical analysis tools that you are comfortable with to increase the accuracy of your trades.
Related Articles
FAQs on What is Ichimoku Cloud?
How accurate is the Ichimoku Cloud?
Like any indicator, the accuracy of the Ichimoku Cloud depends on market conditions and how traders interpret its signals. The Ichimoku Cloud is an effective tool for capturing trends efficiently and is best suited for trending markets. Meanwhile, it may generate false signals in a choppy market. Hence, trades should confirm Ichimoku signals with other indicators or price action before committing to a trade.
What are the 5 lines of Ichimoku?
The 5 lines of the Ichimoku indicator are as follows: 1. Tenkan-Sen (Conversion Line), 2. Kijun-Sen (Base Line), 3. Senkou Span A (Leading Span A), 4. Senkou Span B (Leading Span B) and 5. Chikou Span (Lagging Span).
How to study Ichimoku?
The best way to study Ichimoku is to start by understanding the five components of Ichimoku Cloud. (Tenkan-Sen (Conversion Line), Kijun-Sen (Base Line), Senkou Span A (Leading Span A), Senkou Span B (Leading Span B) and Chikou Span (Lagging Span).) and their functions.
What is the best time frame for Ichimoku?
Ichimoku Cloud can work on all the time frames. However, the best time frame can depend on the trading style and asset a trader trades. However, Ichimoku Cloud is better suited for medium- to long-term trading due to its reliance on historical data and slower-moving components.
Is the Ichimoku Cloud strategy good?
Yes, the Ichimoku Cloud strategy can be effective, especially for identifying trends, momentum, and key support/resistance levels. Traders widely use it for its ability to provide a comprehensive view of the market with a single glance.

