- Offerings
- Tools & Platforms
Tools & Calculators
- Open API
- Calculators
- SIP Calculator
- CAGR Calculator
- Compound Interest Calculator
- FD Calculator
- RD Calculator
- EPF Calculator
- Retirement Calculator
- HDFC SIP Calculator
- Mutual Fund Return Calculator
- Lumpsum Calculator
- Step Up SIP Calculator
- ETF SIP Calculator
- Brokerage Calculator
- Equity Margin Calculator
- SWP Calculator
- EMI Calculator
- MTF Calculator
- Pricing
- SKY Learn
- Mutual Funds
- Margin Trading
- Financial Planning
- Personal Finance
- Share Trading
- IPO
- Derivatives
- Currencies
- Intraday Trading
- Trading Strategies
- Demat Account
- Commodity
- ETF
- What is Marubozu Candlestick?
- What are the Features of Marubozu Candlestick Pattern
- What are the Types of Marubozu Candles
- How to Trade Using the Marubozu Candle?
- Marubozu Signals and Setting Stop-Loss
- Here is a quick look at the difference between the two
- What are the Advantages of Marubozu Pattern
- What are the Limitations of Marubozu Pattern
- Conclusion
- FAQs on What is Marubozu Candlestick?
What is Marubozu Candlestick?
By Shishta Dutta | Updated at: May 15, 2025 05:36 PM IST
Technical charts help online traders see trends (bullish or bearish) and figure out price and volume behaviours. With the help of patterns like the candlestick, they can make strategic trading decisions using these charts. This is why traders make it a point to learn about these charts and know the meaning of the different patterns in them.
Today, we will look at the Marubozu candlestick- a type of candlestick pattern that forms the basis of technical analysis for traders.
What is Marubozu Candlestick?
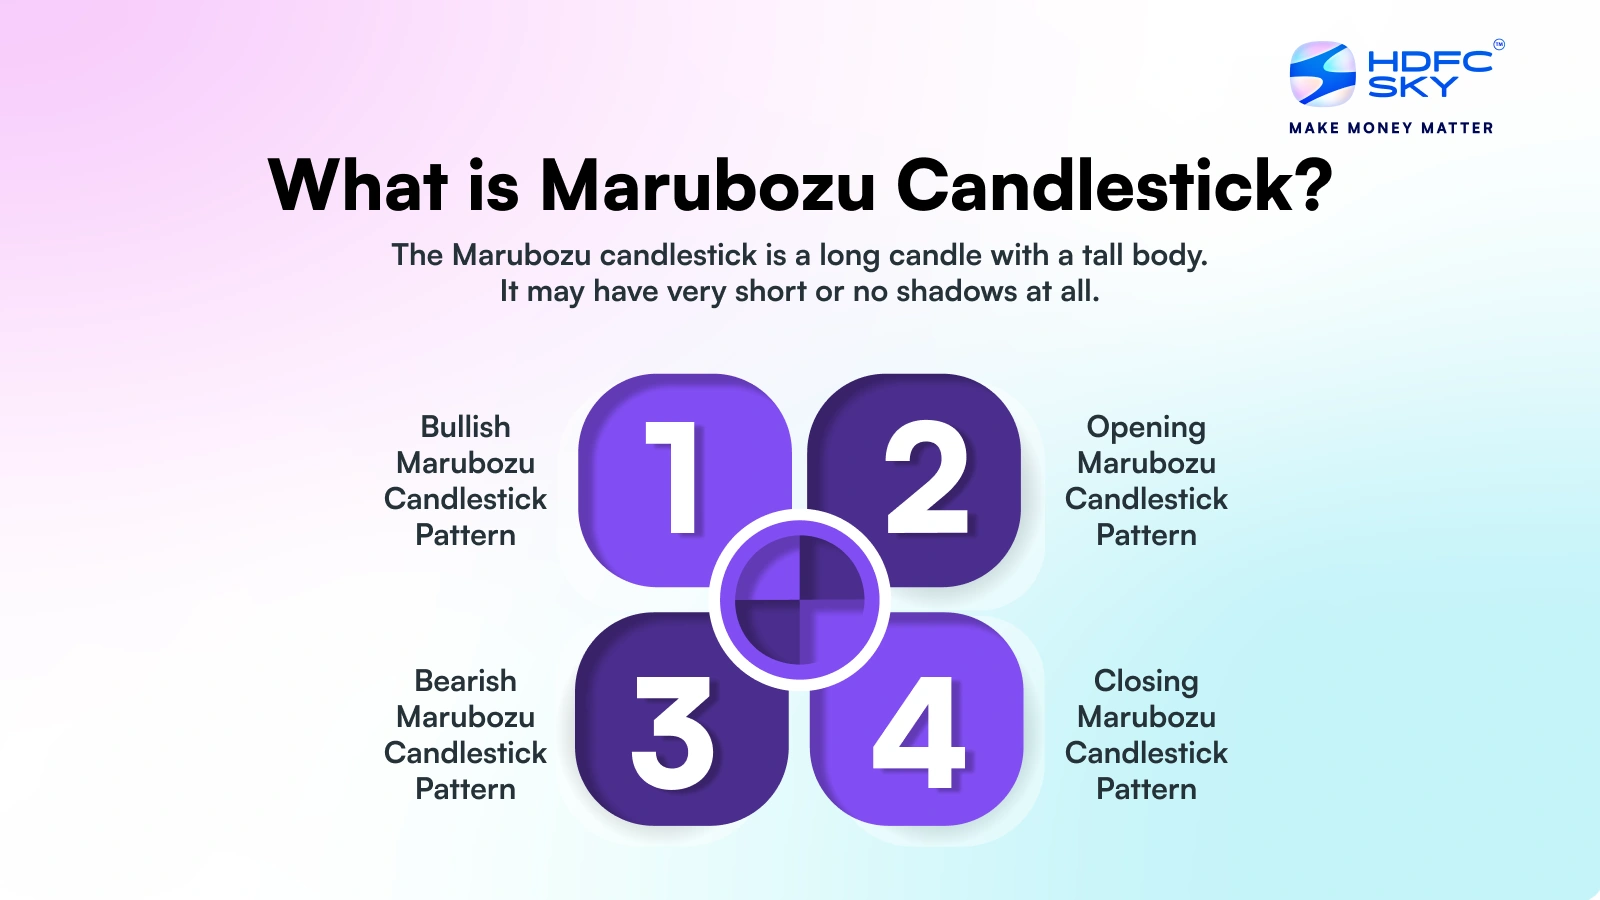
The Marubozu candlestick is a long candle with a tall body. It may have very short or no shadows at all. This is why it is termed as ‘Marubozu’ (meaning ‘bald’ in Japanese).
This type of pattern is the key to identifying strong market momentum. It features a lengthy body and no shadows or wicks. This denotes a pure, uncontested price action.
Whether bullish (green/white) or bearish (red/black), a Marubozu indicates that buyers or sellers dominated the whole trading session. It has the ability to drive the price in one direction from start to finish, signifying a strong trend continuation.
What are the Features of Marubozu Candlestick Pattern
Let us now look at the various features of this pattern that make it hard to miss on a technical chart.
- The Marubozu candle has zero or little upper and lower shadows (wicks). This shows that the opening or closing price is both the highest and lowest price during the trading period. It highlights the complete domination of either buyers or bearish sellers.
- Marubozu designs have a lengthy design. These tend to be substantially lengthier than the surrounding candlesticks. This length indicates significant price movement and high market conviction.
- The Marubozu candle pattern occurs when the opening price is the same as the low or high. Similarly, the closing price would equal the low or high. This shows sustained directional pressure across the entire trading session.
- These distinct patterns are typically seen during the start of strong trends or after consolidation periods. Traders use them to identify likely trend initiations or continuations.
- The size of the Marubozu candle pattern relative to previous candles matters significantly. They have larger bodies compared to recent price action. This type of pattern suggests stronger momentum and a higher probability of trend continuation.
What are the Types of Marubozu Candles
1 – Bullish Marubozu Candlestick Pattern
This is a green candlestick having a large body. It has no (or negligible) shadows. The bullish Marubozu candlestick means that the buyers control the market in that session, and the trend for buying will probably continue.
2 – Bearish Marubozu Candlestick Pattern
This is a red Marubozu candle. Again, it has no (or negligible) shadows. This means that the sellers control the market in that session. The bearish Marubozu candlestick indicates that the stock prices are likely to continue falling.
3 – Opening Marubozu Candlestick Pattern
It shows no shadow on the opening price side. It has a brief wick higher or below the closing prices. This type of candlestick Marubozu starts moving instantly in a specific direction after the opening time.
4 – Closing Marubozu Candlestick Pattern
It shows no shadow on the closing price side. It has a brief wick higher or below the opening prices. This type of candlestick Marubozu depicts that the closing price remained flat. At the same time, the price traded a bit above or below the opening price.
How to Trade Using the Marubozu Candle?
Traders use the signal from the Marubozu candle to decide which way to trade and how to do it. Let us see how to trade with Marubozu candle strategy in two distinct scenarios.
Trading Strategy in Bullish Marubozu
- The bullish Marubozu is denoted by the absence of upper and lower shadows. This means that the opening matches the low, and the high price matches the closing price.
- The pattern reflects extraordinary buying conviction. It shows that the market players will continue buying regardless of the price levels in that session. As a result, the asset’s price inches closer to its high point in that session.
- When a bullish Marubozu candle emerges during an established uptrend, it reinforces the current market direction. Buyers can see further upside potential. However, its appearance within a downtrend carries even more significance. It denotes a potential trend reversal as market sentiment shifts from bearish to bullish.
- Professional traders will look to buy after a bullish Marubozu.
Trading Strategy in Bearish Marubozu
- The bearish Marubozu indicates that the opening matches the high price and the low price matches the closing price.
- The pattern reflects complete control of the sellers. It shows that they will continue selling at every possible price point. As a result, the asset’s price closes near its low point in that session.
- When a bearish Marubozu emerges during a downtrend, it means that the strong trend is likely to continue. Sellers will continue selling in that session. However, its appearance within an uptrend provides an important signal. It denotes a potential trend reversal as market sentiment shifts from bullish to bearish.
- Professional traders will look to sell after a bearish Marubozu.
Hope this gives you an idea about how to trade Marubozu candle.
Marubozu Signals and Setting Stop-Loss
Traders would look to enter, exit or buy/sell based on the appearance of the Marubozu signal. Let us look at the common actions to be performed when you see these two types of patterns.
Typical Trading Actions in Bullish Marubozu
- Trade Entry – Many traders tend to enter a long position when the price goes above the high as indicated by the candle.
- Stop-loss Limit – They will configure the stop-loss price lower than the low price. Such stop-loss orders will help them preserve their wealth in case the trend reverses.
- Target Price – The prior resistance level will indicate a good target price. Many traders also configure a price as per their individual risk-reward choices.
- Typical Trading Actions in Bearish Marubozu
- Trade Entry – Many traders tend to enter a short position when the price goes below the low as indicated by the candle.
- Stop-loss Limit – They will configure the stop-loss price more than the high price.
- Target Price – Many traders will plan an exit as per their individual risk-reward choices. They may short-sell stocks to obtain gains from a downtrend.
- Marubozu and Engulfing Pattern
These are two distinct candlestick patterns used by traders. Using these patterns, they identify trend reversals and continuation signals.
Here is a quick look at the difference between the two
| Characteristic | Marubozu | Engulfing |
| Candlestick | One | Two |
| Appearance | Lengthy body with no wicks | The second candle completely ‘engulfs’ or covers the body of the prior candle |
| What it means | It signifies a likely trend continuation | It signifies a likely trend reversal |
| It denotes a strong momentum in a single direction | It denotes a shift in momentum between two candles |
What are the Advantages of Marubozu Pattern
1 – Strong indicator of trend
Traders get a clearer picture of which way a stock might trade for a given session. This helps them manage their investments effectively. They can follow the trend and mark their trade as per this candlestick design.
2 – Clarity of market sentiment
This particular pattern doesn’t have any shadows or wicks. The clarity helps traders avoid the confusion of more complex patterns.
3 – Reliable Entry and Exit Signals
The Marubozu’s structure provides clear support and resistance levels at its high and low points. This signal can aid in making a more proper placement of stop-loss and take-profit orders.
What are the Limitations of Marubozu Pattern
1 – Uncommon Occurrence
It is rare that an asset would trade in only one direction during a trading session. Hence, the candlestick Marubozu may not appear frequently in normal market conditions. This scarcity means that traders cannot rely on them as their primary trading signal.
2 – Scarcity of Information
The Marubozu candle pattern comes in handy in informing about the opening and closing prices of the stock. It doesn’t give a lot of information about the highest or lowest price points or the intra-day volatility.
3 – Potential of false signals
A volatile or sideways market can generate false signals with this trading pattern. If traders aren’t careful, they might incur a loss with wrong order placements.
Conclusion
This was a gist of the Marubozu candlestick pattern. It also showed its unique traits and how traders use it to their advantage. Knowing about this pattern helps them initiate a trade or exit it with a strategic understanding. They can use it with other indicators to improve their trading strategy.
Related Articles
FAQs on What is Marubozu Candlestick?
What is a Marubozu candle pattern?
The Marubozu is a strong, single candlestick pattern. It represents a charting pattern indicating strong market momentum, either bullish or bearish. It has a tall stick design with minimal or no wicks, which reflects the complete control of either buyers or sellers throughout the trading session. It helps investors to identify whether the price of a stock will rise or fall.
How can I recognise a Marubozu pattern?
A Marubozu candle pattern is a clear full-body candle with little or no upper or lower shadows. A bullish Marubozu candlestick occurs when the candlestick opens at the trading session’s lowest price and closes at the session’s highest. This shows significant buying pressure in the market. Conversely, in a bearish Marubozu, it opens at the highest price and closes at the lowest. This indicates strong selling pressure. These features help you know how to identify the perfect Marubozu candle stick.
Can the Marubozu candlestick pattern be bullish or bearish?
Yes, the Marubozu candlestick pattern can be either bullish or bearish. A bullish Marubozu candlestick has no lower shadow, and it closes at the highest price of the session. This shows a high buying pressure. However, A bearish Marubozu has no upper shadow and closes at the session’s lowest price. This is an indication of strong selling pressure.
What is a bullish Marubozu close?
A bullish Marubozu close is when a candlestick has no lower shadow, and the closing price is at the trading session’s highest point. A green or white candle indicates this pattern with little or no shadows. It shows that there is strong buying pressure as buyers dominated the trading session from start to finish. A bullish Marubozu candlestick is a clear sign of market strength in favour of the buyers.
Is a bullish pattern good?
Yes, a bullish pattern is good since it represents a high buying interest and possibly the potential upward moment in prices. It is a sign of optimism in the market and usually the beginning or continuation of an uptrend. Still, the effectiveness depends on the overall conditions of the market and other technical indicators.
What information does the Marubozu pattern convey to traders?
The Marubozu pattern indicates strong market momentum and decisiveness. A bullish Marubozu signals strong buying pressure throughout the trading sessions. This indicates potential upward movement or trend continuation. Whereas a bearish Marubozu shows that the selling pressure is high, and it would likely continue to move in a downward direction.
How to trade with the Marubozu candle strategy?
To trade using the Marubozu candle strategy, first, look for the pattern. A bullish Marubozu shows strong buying pressure. A bearish Marubozu suggests strong selling pressure. A stop-loss near the opposite end of the Marubozu is used for managing risk. You can set profit targets at previous support or resistance levels. The addition of other tools can also improve the accuracy of trades when using the Marubozu.
How to identify the perfect Marubozu candle stick?
A perfect Marubozu candlestick would have a long body with little to no upper or lower shadows. This indicates that there is a strong and one-sided market movement. The body of the candlestick should be long with an indication of significant price movement in one direction. A perfect Marubozu will signify that either buyers or sellers gained absolute dominance with minimal opposition within the trading session.


