- Offerings
- Tools & Platforms
Tools & Calculators
- Open API
- Calculators
- SIP Calculator
- CAGR Calculator
- Compound Interest Calculator
- FD Calculator
- RD Calculator
- EPF Calculator
- Retirement Calculator
- HDFC SIP Calculator
- Mutual Fund Return Calculator
- Lumpsum Calculator
- Step Up SIP Calculator
- ETF SIP Calculator
- Brokerage Calculator
- Equity Margin Calculator
- SWP Calculator
- EMI Calculator
- MTF Calculator
- Pricing
- SKY Learn
- Mutual Funds
- Margin Trading
- Financial Planning
- Personal Finance
- Share Trading
- IPO
- Derivatives
- Currencies
- Intraday Trading
- Trading Strategies
- Demat Account
- Commodity
- ETF
- What Is Trading Volume?
- Where Can You Find Trading Volume?
- What Does Trading Volume Indicate?
- Importance of Volume in the Stock Market
- Finding Volume on a Chart
- Volume and Price: How Are They Related or Unrelated?
- Volume in Technical Analysis
- Factors Influencing Volume in Stock Market
- What Is a Good Volume for a Stock?
- Conclusion
- FAQs on What is Volume in Stock Market?
What is Volume in Stock Market & What Does Trading Volume Indicate?
By HDFC SKY | Updated at: Sep 24, 2025 01:49 PM IST
Volume meaning in Stock Market is the total number of shares or contracts traded in a security during a specific time period. It is a key indicator of market activity and liquidity helping traders gauge the strength of price movements. High volume often signals strong investor interest, while low volume may indicate weak momentum or uncertainty. Understanding volume is crucial for making informed trading decisions.
What Is Trading Volume?
Trading volume represents the total number of shares or contracts exchanged between buyers and sellers during a defined period typically a trading day. When a transaction occurs, both the buying and selling actions contribute to the volume count.
Unlike static metrics such as market capitalisation trading volume is dynamic and changes continuously throughout the trading day. It provides crucial insights into market liquidity and trader sentiment serving as a vital tool for both technical analysts and fundamental investors.
Deliverable volume refers to the number of shares that are actually transferred from one investor to another after a trading day as opposed to shares traded intraday and then squared off within the same day.
The deliverable volume in the stock market is like counting how many people actually took their seats at the stadium versus those who just passed through the gates. It shows how many shares were actually transferred to buyers’ accounts rather than just traded back and forth.
Where Can You Find Trading Volume?
Trading volume information is readily accessible through various channels, each offering different levels of detail and real-time updates:
- Stock Exchanges: Primary sources like NSE and BSE provide official volume data for all listed securities. These exchanges track and report trading volumes throughout the trading session.
- Financial News Websites: Popular financial portals offer volume data alongside other market metrics often with visual representations through charts and graphs.
- Trading Platforms: Most modern trading platforms incorporate volume data into their charting tools, displaying it as histogram bars below price charts. These platforms often use colour coding (typically green for buying volume and red for selling volume) to provide additional context.
- Broker Interfaces: Your stockbroker’s trading platform typically provides detailed volume information, including real-time updates and historical data.
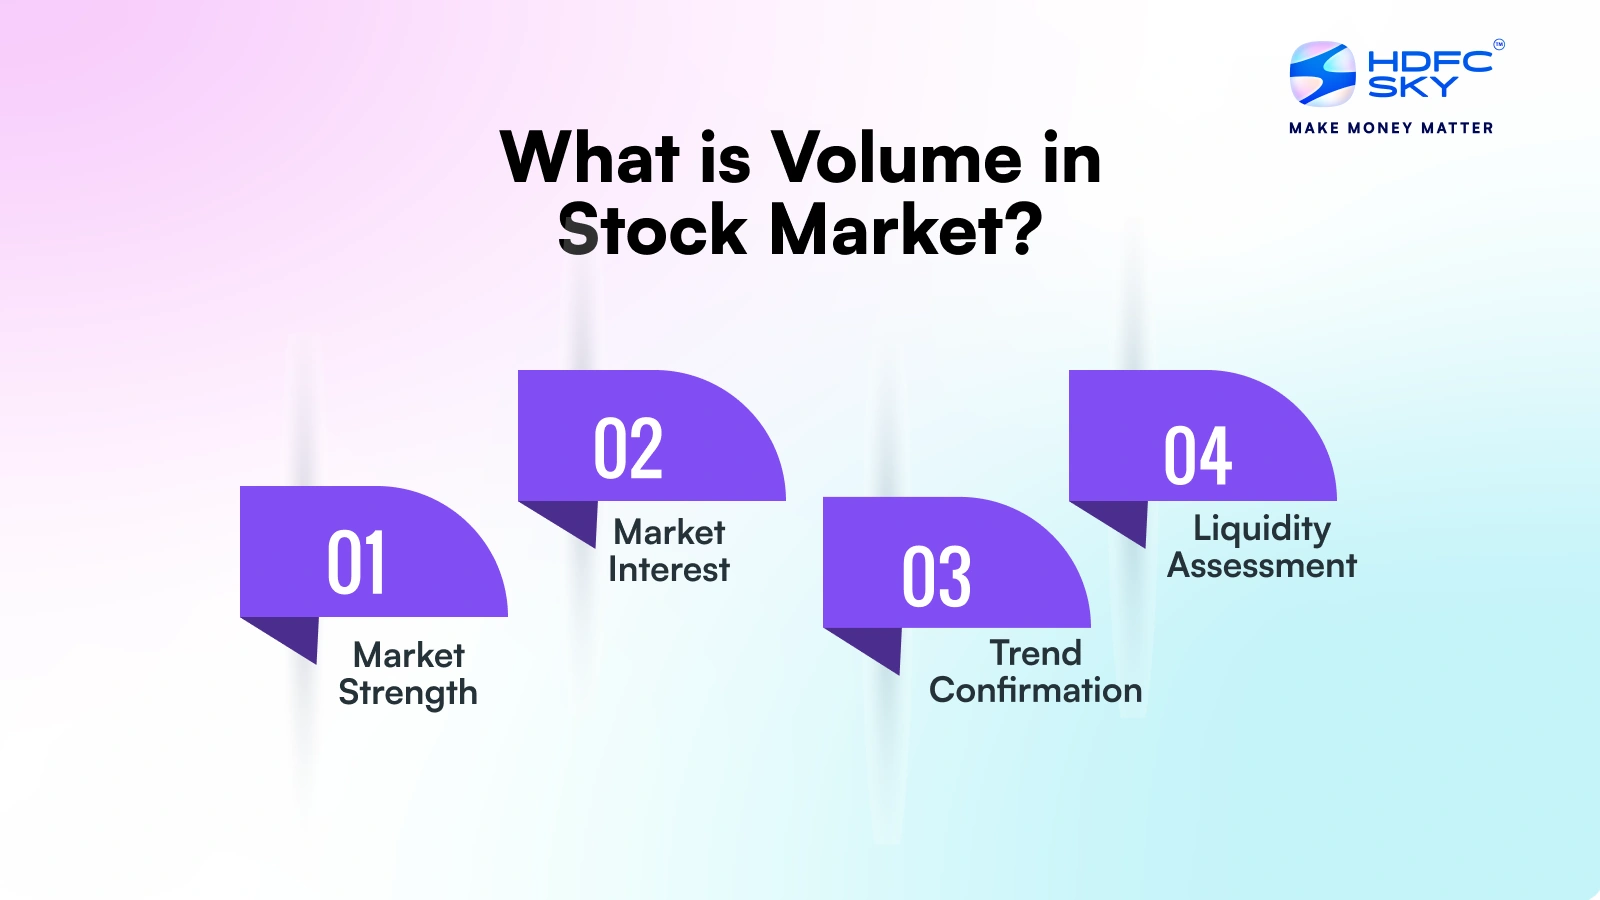
What Does Trading Volume Indicate?
Trading volume serves as a powerful market indicator, offering insights into:
- Market Strength: High volume accompanying price movements suggests optimistic sentiment, while low volume might indicate weak market sentiment.
- Trend Confirmation: Volume often confirms price trends. Rising prices with increasing volume typically indicate a strong uptrend, while falling prices with high volume suggest a strong downtrend.
- Market Interest: Sudden spikes in volume may indicate growing interest in a stock, often preceding significant price movements.
- Liquidity Assessment: Higher trading volumes generally indicate better liquidity, making it easier to enter and exit positions without significantly impacting the price.
Importance of Volume in the Stock Market
Volume plays a vital role in confirming price trends and market strength. It helps traders and investors understand the intensity behind price movements.
- Confirms Trends: Rising prices with high volume signal strong bullish trends, falling prices with high volume confirm bearish trends.
- Identifies Reversals: Sudden spikes in volume can indicate potential trend reversals.
- Measures Liquidity: Higher volume means easier entry and exit with minimal price impact.
- Supports Technical Analysis: Volume patterns like breakouts or consolidations are used to validate chart signals.
- Investor Sentiment: Reflects how actively a stock is being bought or sold indicating confidence or caution.
Finding Volume on a Chart
Volume information is typically displayed at the bottom of stock charts as vertical bars. Interpreting these visual representations involves understanding:
- Bar Height: Taller bars indicate higher volume periods
- Colour Coding: Often green for net buying pressure and red for net selling pressure
- Time Correlation: Volume patterns during specific market hours
- Pattern Recognition: Identifying volume trends and anomalies
Volume and Price: How Are They Related or Unrelated?
Volume and price are closely linked in stock market analysis but their relationship isn’t always straightforward. Together, they help confirm the strength or weakness of a trend.
High Volume + Rising Price:
- Suggests strong buying interest
- Generally considered a positive sign
High Volume + Falling Price:
- Indicates strong selling pressure
- Often signals caution
Volume in Technical Analysis
The role of volume in technical analysis serves as a crucial component for traders and analysts seeking to understand market dynamics. Technical analysts combine volume indicators with price patterns to form a comprehensive view of market conditions. The analysis of trading volume patterns helps confirm trends, identify potential reversals and validate breakout movements. Traders particularly focus on volume spikes which often precede significant price movements and can signal important market shifts.
Popular volume-based technical indicators include the On-Balance Volume (OBV) which tracks buying and selling pressure over time, and the Volume Price Trend (VPT), which relates volume to price changes. These tools help traders identify whether market movements are supported by strong trading volume analysis making them more likely to continue in their current direction.
Important Volume Patterns:
- Rising Volume + Rising Price: Like increasing crowds at a successful shop
- Falling Volume + Rising Price: Similar to a shop raising prices but seeing fewer customers
- High Volume at Price Peaks: Like peak festival shopping before a quiet period
Factors Influencing Volume in Stock Market
Several factors impact trading volume, reflecting investor interest, market sentiment and external events:
- Company News: Earnings, mergers or management changes can spike volume.
- Market Sentiment: Bullish or bearish outlook drives more trading activity.
- Economic Data: Inflation, GDP or interest rate changes influence investor behavior.
- Global Events: Geopolitical tensions or global market movements can affect volume.
- Technical Levels: Breakouts or support/resistance zones attract traders.
- Corporate Actions: Buybacks, dividends or stock splits increase volume.
- Speculation & Rumors: Unconfirmed news can lead to short-term volume surges.
What Is a Good Volume for a Stock?
Determining what constitutes good volume in the stock market depends on various factors, including the company’s size, market capitalisation and typical trading patterns. A large-cap stock might regularly trade millions of shares daily, while a small-cap stock might have much lower volume. Generally consistent trading volume that allows for easy entry and exit of positions without significant price impact is considered good volume.
Investors should consider the average daily trading volume over different periods (such as 10-day, 30-day, or 90-day averages) to establish what normal volume looks like for a particular stock. Significant deviations from these averages often signal important market events or changing investor sentiment.
Conclusion
Remember volume is one piece of a larger puzzle like how a festival’s success isn’t judged solely by attendance. For best results, combine volume analysis with other market indicators much like how a successful business owner considers multiple factors beyond just customer count.
Whether you’re new to trading or an experienced investor, understanding volume helps you make more informed decisions, much like how understanding crowd patterns helps you choose the best time to visit a market. Start paying attention to volume patterns, and you’ll develop a better sense of market movements.
Related Articles
FAQs on What is Volume in Stock Market?
Does Volume Affect Share Price?
Yes, volume can affect share price. High volume often indicates strong buying or selling interest, which can lead to significant price movements or trend confirmations.
What's a good volume for a stock?
Good volume varies by stock and market capitalisation. For large-cap stocks, daily volumes in millions of shares indicate healthy liquidity. Small-cap stocks typically have lower volumes. The key is consistent trading activity that allows easy position entry and exit without significant price impact.
Is high volume good for a stock?
Is high volume good for a stock? High volume can be either positive or negative depending on price action. When accompanied by rising prices, it suggests strong buying interest and trend confirmation. With falling prices, high volume indicates strong selling pressure. The context of the volume increase determines its significance for trading decisions.
How do you know if volume is buying or selling?
Volume direction is determined by analysing price action alongside volume. Rising prices with high volume suggest buying pressure while falling prices with high volume indicate selling pressure. Technical analysts use specialised indicators like On-Balance-Volume (OBV) to track buying versus selling pressure over time.
How is stock volume calculated?
Stock volume is calculated by summing all shares traded during a specific period. Each transaction contributes to the total, regardless of whether it’s a buy or sell. Modern trading platforms automatically track and display this information in real-time throughout trading sessions.
What does high trading volume indicate?
High trading volume indicates strong investor interest and liquidity. This is valuable for traders as it allows them to enter and exit positions quickly and efficiently, minimising slippage and maximising potential profits.
What does low trading volume mean?
- Low trading volume typically indicates reduced market interest or participation. It might suggest uncertainty among traders, lack of significant catalysts.
- Low volume can make trading more challenging due to reduced liquidity and wider bid-ask spreads.
What is the difference between volume and open interest?
Volume measures total trades during a period, while open interest represents the number of outstanding contracts in derivatives markets. Volume resets daily, but open interest accumulates and decreases as positions are opened and closed over time.
What are volume indicators in technical analysis?
Volume indicators include tools like On-Balance Volume (OBV), Chaikin Money Flow (CMF), and Volume Price Trend (VPT). These indicators help traders analyse the relationship between price movements and trading volume to make informed trading decisions.
Where can I check trading volume for a stock or index?
Trading volume can be checked through stock exchange websites, financial news platforms, trading applications, and broker platforms. Most provide real-time volume data alongside other market metrics, often displayed in chart format for easy analysis.
How to calculate volume in the stock market?
Stock market volume calculation is straightforward: simply count the total number of shares traded during a specific period. Each transaction, whether buying or selling, adds to the volume count. For example, if 100 shares are bought and then sold, the total volume is 200.

