- Offerings
- Tools & Platforms
Tools & Calculators
- Open API
- Calculators
- SIP Calculator
- CAGR Calculator
- Compound Interest Calculator
- FD Calculator
- RD Calculator
- EPF Calculator
- Retirement Calculator
- HDFC SIP Calculator
- Mutual Fund Return Calculator
- Lumpsum Calculator
- Step Up SIP Calculator
- ETF SIP Calculator
- Brokerage Calculator
- Equity Margin Calculator
- SWP Calculator
- EMI Calculator
- MTF Calculator
- Pricing
- SKY Learn
- Mutual Funds
- Margin Trading
- Financial Planning
- Personal Finance
- Share Trading
- IPO
- Derivatives
- Currencies
- Intraday Trading
- Trading Strategies
- Demat Account
- Commodity
- ETF
- What is Williams %R Indicator?
- Formula & Calculation of Williams %R Indicator
- Interpretation and Working of Williams %R Indicator
- Advantages of the Williams %R Indicator
- Limitations of Williams %R Indicator
- Other Technical Indicators To Pair With the Williams %R
- The Difference Between Williams %R vs the Fast Stochastic Oscillator
- Conclusion
- FAQs on What is Williams %R Indicator?
What is Williams %R Indicator? Formula, Uses, and Limitations
By HDFC SKY | Updated at: Jul 24, 2025 06:13 PM IST
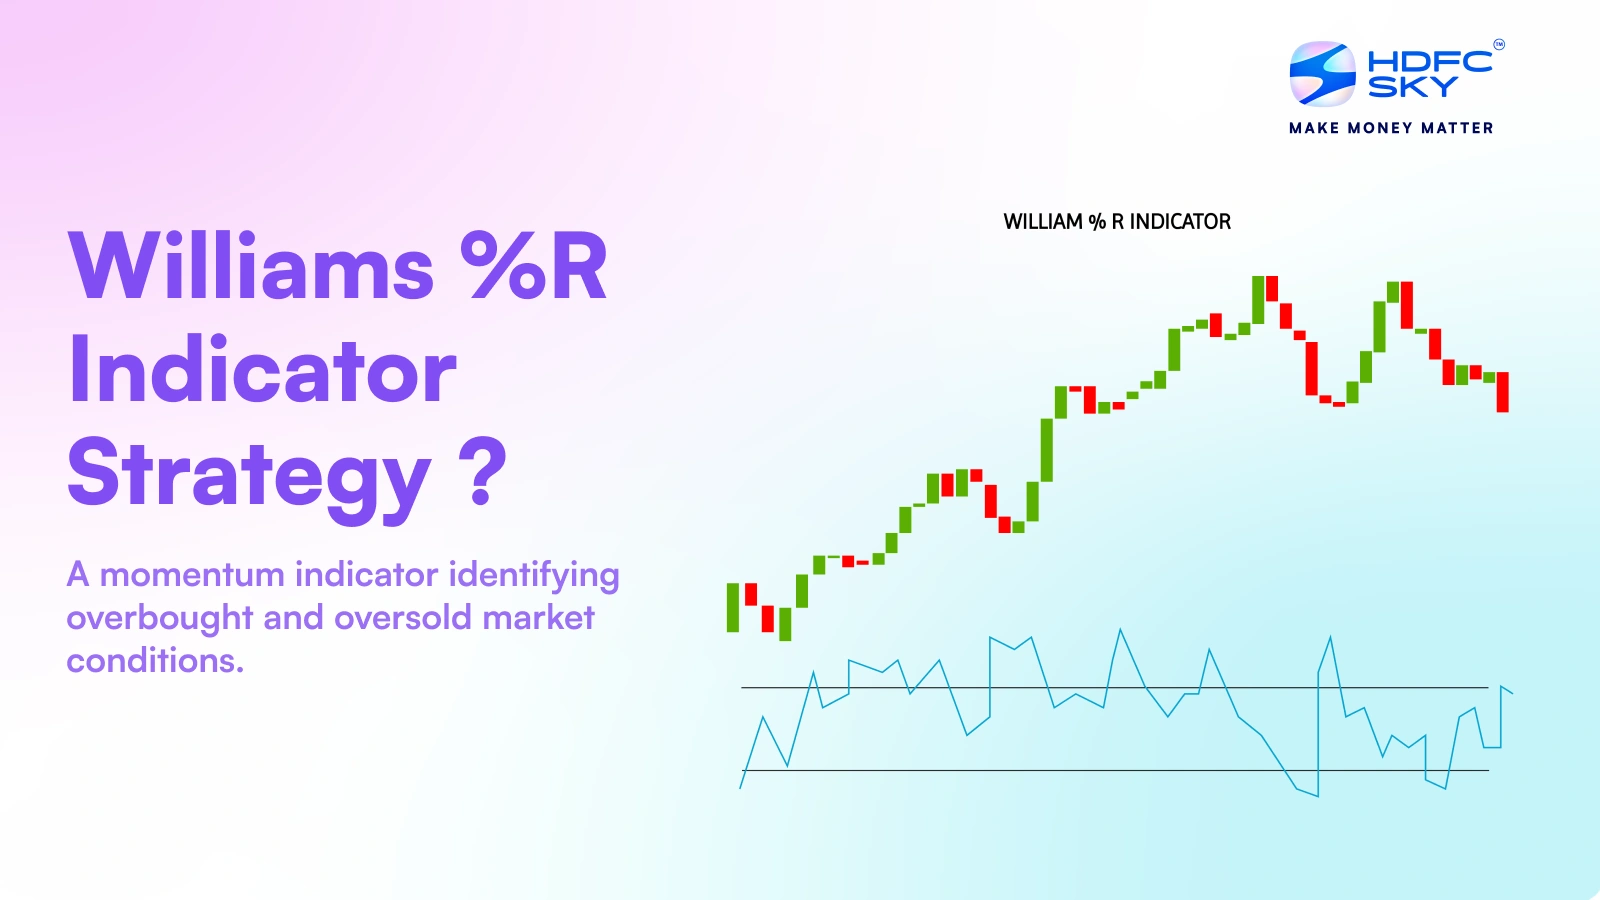
- Williams %R Indicator Overview: The article explains the Williams %R (Williams Percent Range) as a momentum-based technical indicator used to identify overbought and oversold levels in the market. It ranges from 0 to -100 and is similar in use to the Stochastic Oscillator.
- Calculation Method: Williams %R = (Highest High – Close) / (Highest High – Lowest Low) × -100, typically using a 14-period lookback. It highlights the close relative to the high-low range.
- Interpretation Signals:
- A reading above -20 indicates an overbought condition.
- A reading below -80 indicates an oversold condition.
- Quick reversals from extremes may signal potential trend changes.
- Trading Strategy Insights: The indicator works best in range-bound markets, helping traders enter or exit based on price reversals. It’s less reliable during strong trends unless combined with other tools.
- Limitations & Tips: It can give false signals in trending markets. Traders are advised to use it with volume indicators or trend-following tools for confirmation.
- Application: Useful for short-term traders and intraday strategies, especially for timing entries and exits.
Williams %R is a technical indicator. A reading between 0 and -20 indicates overbought level. A reading between -80 and – 100 indicates oversold level. Larry Williams created the Williams %R indicator in 1960. This is a momentum oscillator used to determine when a trade is overbought or oversold.
This indicator, which ranges from 0 to -100, aids traders in identifying possible reversals. It may help in improving the timing of entry-exit points during times of market volatility.
Today, we will explore the Williams percentage R indicator, its formula and how it is calculated, its advantages, limitations, the difference between the Williams %R and the Fast Stochastic Oscillator, and other important information.
What is Williams %R Indicator?
Created by Larry Williams, the Williams %R indicator is a momentum indicator. It is also known as the Williams Percent Range. Williams %R indicates the position of the closing price in relation to the highest high within a specified look-back period.
In contrast, the Stochastic Oscillator shows the closing price relative to the lowest low. Williams %R adjusts for this inversion by multiplying the raw value by -100. Consequently, the Fast Stochastic Oscillator and Williams %R produce identical lines but differ in their scaling.
Williams %R indicator ranges from 0 to -100. This means that levels from 0 to -20 are deemed overbought, whereas levels from -80 to -100 are considered oversold. As expected, the signals generated from the Stochastic Oscillator are also relevant to the Williams %R indicator.
Formula & Calculation of Williams %R Indicator
To calculate the Williams %R indicator, the following formula is used:
%R = (Highest High – Current Close) / (Highest High – Lowest Low) * – 100
- Lowest Low = The lowest low for the look-back period.
- Highest High = The highest high for the look-back period.
- %R is multiplied by -100 to correct the inversion and move the decimal.
The price for the Williams %R indicator is usually for the previous 14 periods. For each of the 14 days, note the high and low points.
- It is important to note the current, highest, and lowest prices for the 14th period. All of the Williams %R indicator formula variables are now available to you.
- Note the current, highest, and lowest prices for the 15th period, but only for the previous 14 periods, not the most recent 15. Determine the new Williams percentage R value.
- Calculate the new Williams %R after each period, utilising only the data from the previous 14 periods.
Interpretation and Working of Williams %R Indicator
Williams %R indicator formula measures the close relative to the high-low range over a set period, ranging from 0 to -100. A close near the high results in a higher %R (e.g., -20), while a close near the low results in a lower %R (e.g., -70).
The -50 midpoint is key: a value more than -50 suggests strength (upper range), and less than -50 indicates weakness (lower range).
Readings below -80 signal oversold conditions and above -20 indicate overbought levels, helping traders identify potential reversals.
Advantages of the Williams %R Indicator
Here are some of the advantages of the Williams %R indicator:
-
Entry and Exit Points
Williams %R can be used effectively at entry and exit points. When the indicator is above -20 (overbought) or below -80 (oversold), it signals overbought or oversold conditions. Traders use these levels to enter or exit trades, so that they can lock possible profits at key market turning points.
-
Confirmation Tool
Williams %R can be used as a confirmation tool with other indicators. It helps validate and confirm trends other technical analysis methods indicate, enhancing their reliability.
-
Risk Management
Williams %R helps you manage risk by providing signals of extreme market conditions. When the indicator shows overbought or oversold conditions, it suggests that prices might reverse. Traders can adjust stop-loss orders or reduce position size to minimise possible loss.
Limitations of Williams %R Indicator
Here are some of the limitations of the Williams %R indicator:
-
Lack of Trend Confirmation
Williams %R does not confirm whether a trend is in place, making it less useful in trending markets. While it can identify overbought or oversold conditions, it does not indicate the strength or direction of the trend, potentially leading to false signals in strong trends.
-
No Price Trend Information
Unlike trend-following indicators like moving averages, Williams %R provides no information about the overall price trend. It only focuses on the current position of prices relative to recent highs and lows, which can be misleading in volatile markets.
-
Limited Application for Range-Bound Markets
Williams %R may give too many signals of overbought or oversold conditions in range-bound or sideways markets, leading to whipsaws and confusion. Its effectiveness is diminished in such market conditions, where prices oscillate within a range rather than trending.
-
No Consideration of Fundamental Factors
Williams %R is a purely technical indicator and does not factor in fundamental analysis. It may provide misleading signals in markets influenced by significant news events or changes in economic conditions that are not reflected in price movements.
-
Parameter Sensitivity
The performance of Williams %R heavily depends on its settings. Minor adjustments to the time period or threshold levels can lead to drastically different signals. This sensitivity makes it less reliable if incorrectly calibrated, and its performance may vary across various asset classes or timeframes.
Other Technical Indicators To Pair With the Williams %R
Here are some other technical indicators you can pair with the Williams %R:
- Trend Confirmation: Use moving averages to identify the overall trend direction. This will allow you to act only on the Williams %R signals that align with the prevailing trend.
- Volatility Assessment: Bollinger Bands can help gauge market volatility, providing context for how extreme the Williams %R readings might be.
- Divergence Confirmation: Look for divergences between the price action and the Williams %R to signal potential reversals.
- Momentum Strength: Indicators like RSI and CCI can give more insights into the strength of price movements, complementing the overbought/oversold signals from the Williams %R.
The Difference Between Williams %R vs the Fast Stochastic Oscillator
| Aspect | Williams %R | Fast Stochastic Oscillator |
| Attempts to Measure | Momentum and potential reversal points by comparing the closing price to the recent price range | Momentum and potential reversal points by comparing closing price to recent lows |
| Primary Use | Identifying overbought/oversold conditions and potential entry/exit points | Identifying overbought/oversold conditions, momentum shifts, and potential entry/exit points |
| Scale | 0 to -100 (inverted) | 0 to 100 |
| Components | Single line | Two lines: %K (main) and %D (3-period SMA of %K) |
| Sensitivity | Most responsive to price changes | Very responsive to price changes |
| Signals | Primarily level-based (overbought/oversold) | Includes level-based and crossover signals |
| Divergence | Less commonly used for divergence | Frequently used for divergence analysis (measuring situations where the price and the indicator line moving in opposite directions) |
| Calculation Complexity | Simplest | Intermediate |
Conclusion
Larry Williams indicator, known as Williams %R, measures overbought and oversold conditions in the market, ranging from 0 to -100. The indicator helps traders identify potential reversal points by indicating when an asset might be overbought or oversold.
While it is particularly effective in range-bound markets and short-term trading, its sensitivity can lead to false signals, especially in trending markets. To mitigate these risks, it’s often used with other tools and indicators for confirmation.
Related Articles
FAQs on What is Williams %R Indicator?
What is the best timeframe for the Williams %R indicator?
The best setting for the Williams %R indicator is typically 14 periods, which can be adjusted based on the asset and timeframe. Shorter periods (e.g., 7) make the indicator more sensitive, while more extended periods (e.g., 21) smoothen signals for more reliable trends.
How do you read a Williams Alligator indicator?
The Williams Alligator uses three smoothed moving averages: the Jaw (13-period), Teeth (8-period), and Lips (5-period). A bullish signal occurs when the Lips cross above the Teeth and Jaw, indicating a trend. A bearish signal occurs when the Lips cross below the other lines.
How do you use the Williams Accumulation Distribution indicator?
The Williams Accumulation Distribution (A/D) indicator tracks the cumulative money flow into and out of an asset. A rising A/D indicates accumulation (buying pressure), while a falling A/D signals distribution (selling pressure). Use it with price trends to confirm or predict potential reversals.
Is Stochastic the same as Williams %R?
No, Stochastic and Williams %R are similar but different. Both measure overbought or oversold conditions, but Williams %R compares the close to the highest high over a set period, while Stochastic compares the current price to the high and low prices over a range.
How to trade with Williams %R?
To trade with Williams %R, one may buy when the indicator crosses above -80 (indicating an oversold condition) and one may sell when it crosses below -20 (indicating an overbought condition). But this tool should only be used along with other indicators.
When should you use Williams %R?
Williams %R is best used in range-bound markets, identifying overbought and oversold conditions. It is helpful for mean-reversion strategies, signalling potential price reversals when the indicator moves into extreme zones (-80 or below for oversold, -20 or above for overbought).
How can the Williams %R be made more robust?
To make the Williams %R more robust, use it with trend-following indicators such as moving averages or other oscillators like RSI or MACD. Adjust the period setting for the asset’s volatility and use it alongside support/resistance levels for better context and decision-making.

