- Offerings
- Tools & Platforms
Tools & Calculators
- Open API
- Calculators
- SIP Calculator
- CAGR Calculator
- Compound Interest Calculator
- FD Calculator
- RD Calculator
- EPF Calculator
- Retirement Calculator
- HDFC SIP Calculator
- Mutual Fund Return Calculator
- Lumpsum Calculator
- Step Up SIP Calculator
- ETF SIP Calculator
- Brokerage Calculator
- Equity Margin Calculator
- SWP Calculator
- EMI Calculator
- MTF Calculator
- Pricing
- SKY Learn
- Mutual Funds
- Margin Trading
- Financial Planning
- Personal Finance
- Share Trading
- IPO
- Derivatives
- Currencies
- Intraday Trading
- Trading Strategies
- Demat Account
- Commodity
- ETF
- What is Inverted Hammer Candlestick Pattern?
- Types of Inverted Hammer Candlestick Patterns
- When Does the Inverted Hammer Candlestick Pattern Occur?
- How to Identify an Inverted Hammer Pattern?
- Inverted Hammer Trading Strategy
- How Do Hammer and Inverted Hammer Candles Work?
- Advantages and Limitations of the Inverted Hammer Pattern
- What are other types of Candlestick besides Inverted Hammer?
- Conclusion
- FAQs on What is Inverted Hammer Candlestick Pattern?
What is Inverted Hammer Candlestick Pattern?
By HDFC SKY | Updated at: Jul 25, 2025 03:24 PM IST
Summary
- Inverted Hammer Candlestick Pattern is a bullish reversal signal that typically appears after a downtrend, indicating potential trend reversal.
- The pattern is characterized by:
- A small real body at the bottom.
- A long upper shadow at least twice the body length.
- Little or no lower shadow.
- It can be red or green, but green is considered more bullish.
- Market psychology behind it reflects initial selling pressure followed by buying interest strong enough to push the price up, although it closes slightly above or below the open.
- The pattern requires confirmation through the next candle closing higher to validate a bullish reversal.
- Traders often combine it with volume analysis, support zones, or technical indicators like RSI or MACD for stronger confirmation.
- Risk management is key: common strategies include placing stop-loss below the Inverted Hammer’s low and using target levels based on resistance areas or prior highs.
- It is not effective as a standalone signal; it works best as part of a broader technical strategy.
Trading in the financial markets requires a good plan, the right timing, and a clear understanding. Candlestick patterns are among the many tools traders use. They are very useful and give deep insights. One pattern that has become very popular is the ‘Inverted Hammer Candlestick Pattern,’ which helps predict changes in trend direction.
Let’s look closely at this interesting pattern to understand how it forms, what it means, and how traders can use it effectively.
What is Inverted Hammer Candlestick Pattern?
An inverted hammer candlestick pattern forms at the end of a downtrend, signalling a potential market reversal. This pattern resembles an upside-down hammer, is the opposite of a traditional hammer candlestick, and shares structural similarities with the shooting star pattern.
- The inverted hammer candlestick is a bullish reversal indicator that indicates market sentiment may be shifting.
- Traders often use this pattern to identify potential opportunities for a long position.
- It implies that the bearish trend might be losing momentum, signalling a change in direction and a possible upward move in price.
Here are the key features of this pattern:
- A small real body (green or red;).
- A tall upper shadow is at least 2x the size of the actual body.
- Little to no lower shadow (keeping it neat).
This pattern suggests that while sellers have been in control, buyers are starting to push back, indicating a potential shift in momentum. It aptly defines the inverted hammer candle meaning.
Types of Inverted Hammer Candlestick Patterns
The Inverted Hammer Pattern appears in two variations, differentiated by the colour of the candlestick body:
Red Inverted Hammer Candlestick
A red inverted hammer is generated when the closing price is slightly lower compared to the opening price. This pattern suggests that while buyers attempted to push the price higher, the sellers managed to uphold control by closing below the opening level.
- Type: Red Hammer Candlestick
- Colour: Red
- Indication: Slightly bearish but hints at a reversal
Green Inverted Hammer Candlestick
A green inverted hammer occurs when the closing price is higher than the opening price, indicating a more bullish sentiment compared to its red counterpart. This pattern suggests that buyers managed to end the session with a gain despite facing bearish pressure.
- Type: Green Hammer Candlestick
- Colour: Green
- Indication: Stronger Bullish Sentiment
When Does the Inverted Hammer Candlestick Pattern Occur?
The inverted hammer typically appears at the bottom of a downtrend, signalling that selling pressure may be easing and buying momentum might be starting to build.
Here’s a step-by-step breakdown of when it appears:
- After a Prolonged Downtrend: The pattern thrives well when the market has been down for a reasonably long period. It is a signal that market conditions may finally be changing.
- During Market Uncertainty: When traders are unsure about the next move, this pattern hints at a possible reversal. It acts as a signal to pay closer attention.
Note
The pattern emerges when prices rise during the session due to bullish activity but face resistance from bearish pressure, pushing the price back near the opening level. This results in a tall upper shadow and a small body, forming the distinctive inverted hammer shape.
Remember!
Spotting this pattern is not enough; it is like finding a map without knowing the destination. Always combine it with other technical indicators to confirm the reversal signal. That is the secret to unlocking its potential!
How to Identify an Inverted Hammer Pattern?
Here is how you can identify an inverted hammer pattern-
- Look for the Tall Upper Shadow: The inverted hammer pattern features an upper shadow that is at least twice as long as its small body.
- Check the Body’s Position: The body sits at the bottom of the candlestick. It does not matter if it is green (inverted bullish hammer) or red (bearish), both are valid. It is all about where its placement is, not its colour.
- No Lower Shadow? Perfect: Ideally, this candlestick does not have a lower shadow, or it is so tiny you might miss it. That clean lower edge is what makes it unique.
The inverted hammer typically appears at the base of a downtrend. If it seems to be in the middle of a sideways market or an uptrend, it’s likely out of context and not a reliable signal.
Inverted Hammer Trading Strategy
You must integrate the inverted hammer candle pattern with other technical tools and strategies to unlock its full potential.
- Wait for Confirmation: A bullish candlestick right after the inverted hammer proves the reversal.
- Employ Support Levels: To make the pattern more reliable, ensure that it aligns well with an essential support level.
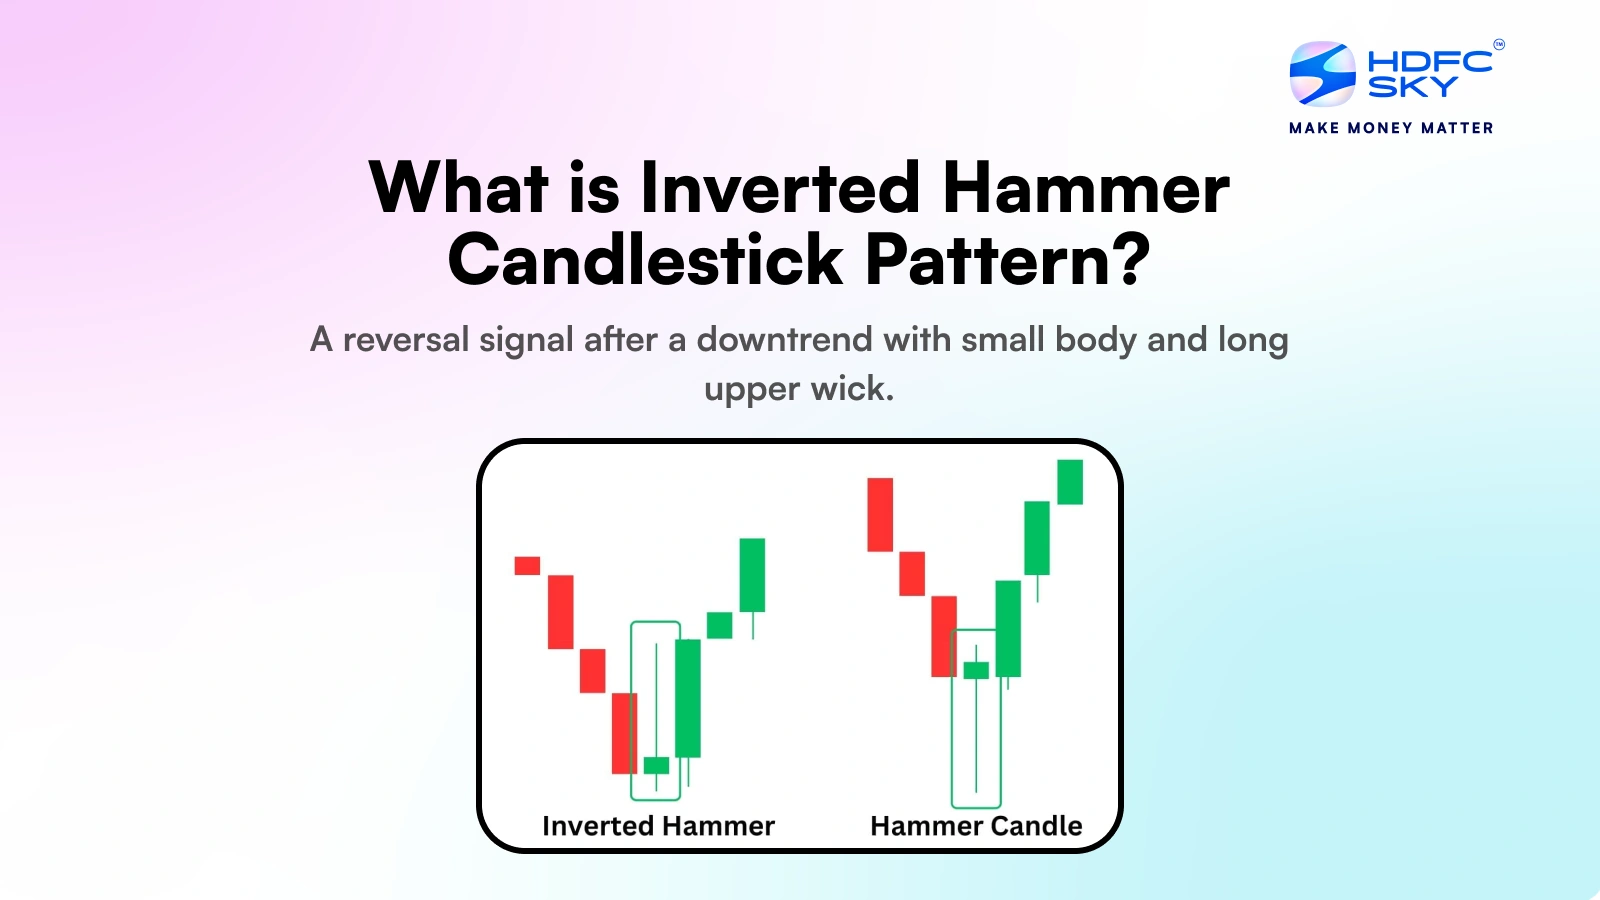
How Do Hammer and Inverted Hammer Candles Work?
Both Hammer and Inverted Hammer candlestick patterns indicate potential trend reversals, typically appearing after a downtrend.
Hammer Candlestick:
- Forms at the bottom of a downtrend, suggesting a possible bullish reversal.
- It has a small body with a long lower wick, indicating buyers regained control after sellers pushed prices lower.
- A confirmation candle is needed to validate the reversal.
Inverted Hammer Candlestick:
- Appears at the end of a downtrend, signaling a potential bullish reversal.
- It has a small body with a long upper wick, showing buyers attempted to push prices higher but faced resistance.
- Confirmation through a strong bullish candle strengthens its reliability.
Both patterns help traders spot trend reversals and plan entry points with confirmation from other indicators.
Advantages and Limitations of the Inverted Hammer Pattern
Let’s have a look at the benefits and challenges presented by this pattern:
Advantages:
- Easy to identify.
- Provides early signals of trend reversal.
- Effective when combined with other indicators.
Limitations:
- Not always reliable in isolation.
- Requires confirmation from subsequent price action.
- It can generate false signals in low-volume markets.
What are other types of Candlestick besides Inverted Hammer?
Besides the Inverted Hammer, common candlestick patterns include:
1. Bullish Patterns
- Hammer – Signals potential reversal at the bottom of a downtrend.
- Bullish Engulfing – A larger bullish candle engulfs a smaller bearish one.
- Morning Star – A three-candle reversal pattern from bearish to bullish.
2. Bearish Patterns
- Shooting Star – Indicates reversal at the top of an uptrend.
- Bearish Engulfing – A large bearish candle engulfs a smaller bullish one.
- Evening Star – A reversal pattern from bullish to bearish.
3. Continuation Patterns
- Doji – Shows market indecision with nearly equal open and close.
- Spinning Top – Indicates uncertainty with a small body and long wicks.
- Three White Soldiers/Black Crows – Signals strong trend continuation.
Conclusion
The candlestick pattern inverted hammer is very useful for traders, giving clues about possible market changes. Though it should not be the only thing a trader looks at, its usefulness increases when used together with checking trading volume, support points in the market, and other technical tools. By learning this pattern well, traders can handle the challenges of financial markets with more confidence and accuracy.
Related Articles
FAQs on What is Inverted Hammer Candlestick Pattern?
How does the inverted hammer candlestick indicate a trend reversal?
The inverted hammer suggests a shift in market sentiment to bullish from bearish, a clear indication of a possible reversal.
How is an inverted hammer different from a shooting star?
While the inverted hammer signals a bullish reversal after a downtrend, the shooting star indicates a bearish reversal after an uptrend.
How can traders use the inverted hammer pattern effectively?
Traders should wait for confirmation from subsequent bullish candles and align trades with support levels and indicators.
What is the significance of a green inverted hammer?
Aninverted green hammerindicates stronger bullish momentum compared to a red one. It shows that buyers gained control despite initial selling pressure.