- Offerings
- Tools & Platforms
Tools & Calculators
- Open API
- Calculators
- SIP Calculator
- CAGR Calculator
- Compound Interest Calculator
- FD Calculator
- RD Calculator
- EPF Calculator
- Retirement Calculator
- HDFC SIP Calculator
- Mutual Fund Return Calculator
- Lumpsum Calculator
- Step Up SIP Calculator
- ETF SIP Calculator
- Brokerage Calculator
- Equity Margin Calculator
- SWP Calculator
- EMI Calculator
- MTF Calculator
- Pricing
- SKY Learn
- Mutual Funds
- Margin Trading
- Financial Planning
- Personal Finance
- Share Trading
- IPO
- Derivatives
- Currencies
- Intraday Trading
- Trading Strategies
- Demat Account
- Commodity
- ETF
What Are Trendlines? Meaning, Importance and Types
By HDFC SKY | Updated at: Oct 13, 2025 11:02 AM IST
A trend line is a straight line drawn on a chart that connects two or more price points helping traders and investors identify the direction of the market. It serves as a tool in technical analysis to visualise support and resistance levels and to determine the overall trend whether upward, downward or sideways.
What are Trendlines?
Trendline meaning in technical analysis refers to a straight line drawn on a chart that connects two or more price points to highlight the prevailing direction of the market. It helps traders and investors understand the overall momentum whether the market is trending upward, downward or moving sideways.
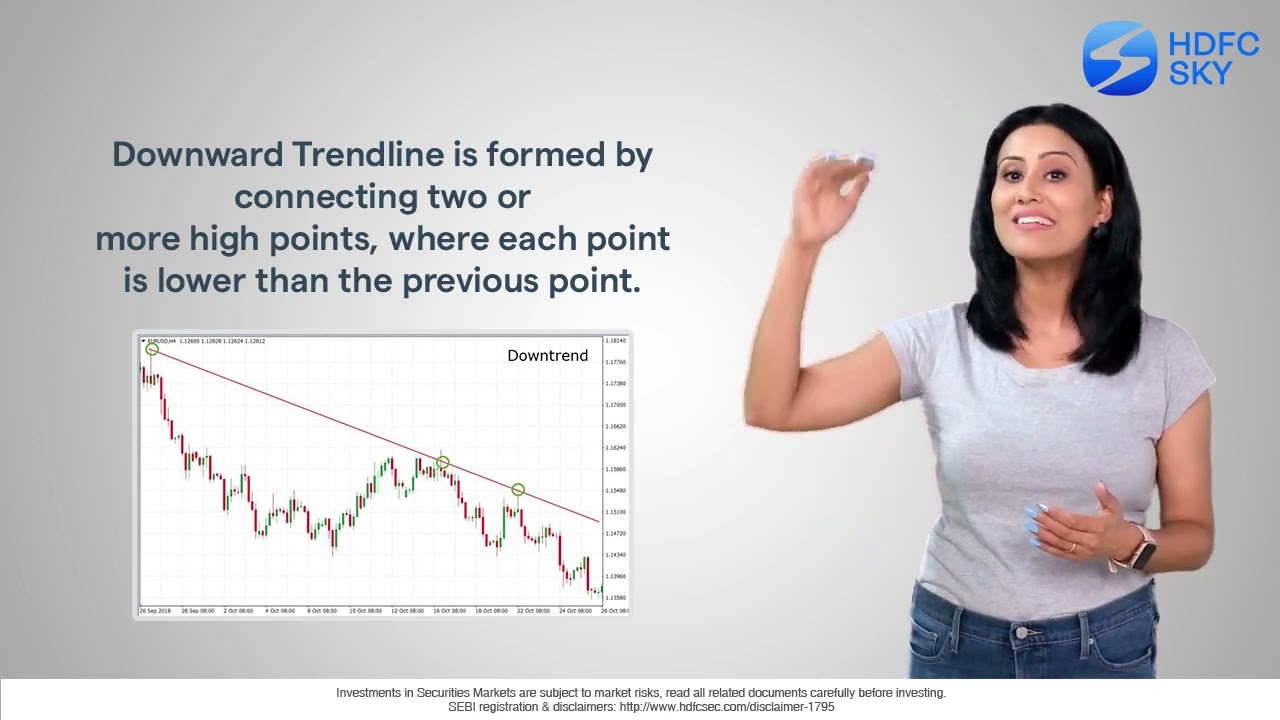
In an uptrend the trendline is drawn below the price connecting higher lows acting as a support level. In a downtrend, it is drawn above the price connecting lower highs, serving as resistance. Trendlines are essential tools for identifying entry and exit points setting stop-loss levels and confirming trend reversals or continuations.
How Does a Trendline Work?
A trendline works by visually representing the direction and strength of a trend in a price chart. It helps traders spot buying or selling opportunities based on price behavior around the line.
- In an uptrend: The trendline is drawn below price lows and acts as a support level.
- In a downtrend: The trendline is drawn above price highs and serves as resistance.
- Breakouts: If the price breaks the trendline it may indicate a trend reversal or continuation.
- Confirmation: More touches on the trendline without breaking it increases its reliability.
How to Access the Trend Line Tool?
You can use the trend line tool through most charting platforms and trading apps.
- Open any stock chart on your preferred platform
- Look for the “Trend Line” tool, usually under the drawing tools section
- Select the tool, then click and drag between two price points to draw your trendline
- Adjust as needed to fit the price action properly
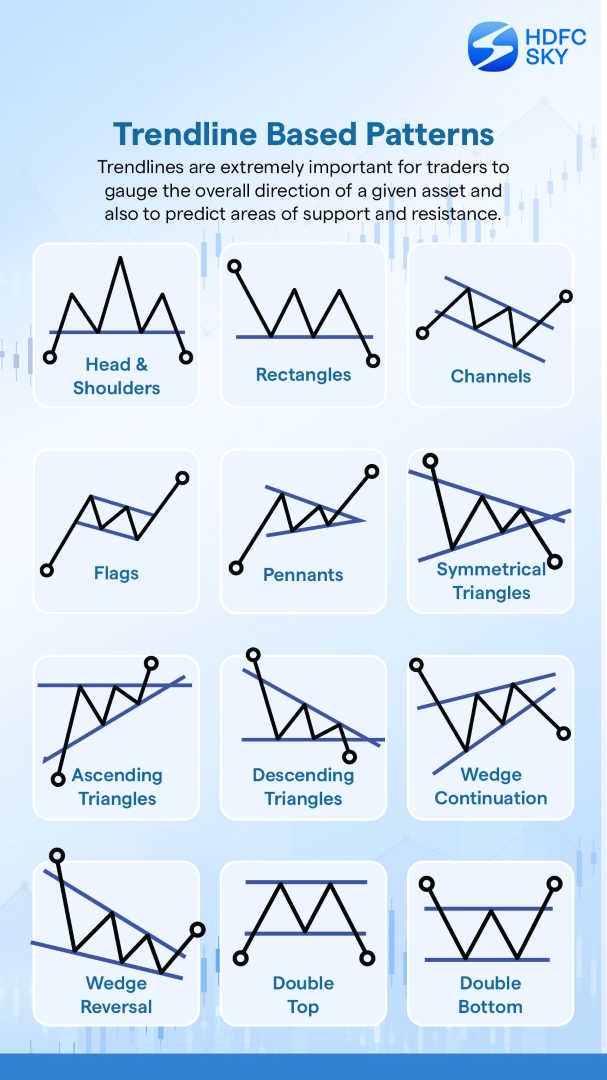
Trendline-Based Patterns
Trendline-based patterns use trendlines to identify potential price movements and reversals in the market. These patterns help traders make informed decisions.
Importance of Trendline
Trendlines are crucial tools in technical analysis as they help traders and investors understand the direction and strength of a market trend.
- Identify ongoing trends (bullish or bearish)
- Spot trend reversals early
- Assist in entry and exit decisions
- Determine support and resistance zones
- Simplify price action analysis visually
What is the Use of Trend Line?
Trend lines are used to identify and confirm the direction of market trends. They help traders make informed decisions about entry and exit points.
- Highlight support and resistance levels
- Confirm trend direction (uptrend or downtrend)
- Spot potential breakouts or reversals
- Set stop-loss and target levels effectively
- Improve overall technical analysis accuracy
Types of Trendline
Trendlines help identify the direction of price movements and come in different forms based on market trends:
- Uptrend Line: Connects higher lows in an ascending market, indicating bullish momentum.
- Downtrend Line: Connects lower highs in a descending market, indicating bearish momentum.
- Horizontal Trendline: Connects equal highs or lows, showing support or resistance levels.
- Steep Trendline: Indicates strong price movement but can be less sustainable.
- Shallow Trendline: Shows gradual price movement, often indicating consolidation.
Advantages of Trendline in Trading
Trendlines help traders make informed decisions by offering visual clarity on market trends and potential price movements.
- Easy to understand and draw
- Helps identify trend direction (uptrend/downtrend)
- Useful for spotting entry and exit points
- Aids in detecting support and resistance levels
- Can confirm breakout and breakdown patterns
- Works across different timeframes and asset classes
Limitations of Trendline in Trading
While trendlines are helpful, they are not foolproof and can sometimes give misleading signals.
- Subjective different traders may draw trendlines differently
- Not effective in sideways or highly volatile markets
- Can break easily due to sudden news or events
- Prone to false breakouts, leading to wrong decisions
- Requires regular adjustments as price movements evolve
Conclusion
Trendlines are simple yet powerful tools that help traders and investors understand the market’s direction and behaviour. By connecting price points, trendlines visually represent support and resistance zones, making it easier to identify buying and selling opportunities. While they are not always accurate and require regular adjustments, combining trendlines with other technical indicators can improve decision-making and reduce trading risks. Whether you are a beginner or an experienced trader, learning to draw and interpret trendlines can greatly improve your ability to analyse price trends and make better trading decisions.
Related Articles
FAQs
What is the purpose of a trendline?
A trendline helps traders identify the direction and strength of a market trend by connecting price highs or lows over time.
What does a trendline represent?
A trendline represents the general movement of price uptrend, downtrend, or sideways serving as support or resistance in technical analysis.