- Offerings
- Tools & Platforms
Tools & Calculators
- Open API
- Calculators
- SIP Calculator
- CAGR Calculator
- Compound Interest Calculator
- FD Calculator
- RD Calculator
- EPF Calculator
- Retirement Calculator
- HDFC SIP Calculator
- Mutual Fund Return Calculator
- Lumpsum Calculator
- Step Up SIP Calculator
- ETF SIP Calculator
- Brokerage Calculator
- Equity Margin Calculator
- SWP Calculator
- EMI Calculator
- MTF Calculator
- Pricing
- SKY Learn
- Mutual Funds
- Margin Trading
- Financial Planning
- Personal Finance
- Share Trading
- IPO
- Derivatives
- Currencies
- Intraday Trading
- Trading Strategies
- Demat Account
- Commodity
- ETF
- What is Swing Trading in Stock Market?
- How Swing Trading Works
- How to Do Swing Trading
- Importance of Swing Trading
- Types of Swing Trading Patterns
- Why Do Swing Trading Patterns Matter?
- How to Identify and Apply Patterns Effectively?
- Advantages of Swing Trading
- Disadvantages of Swing Trading
- Swing Trading Strategies
- Common Mistakes to Avoid When Trading Patterns
- Technical Indicators to Complement Swing Trading Patterns
- Difference Between Swing Trading and Long-Term Investing
- Conclusion
- FAQs on What is Swing Trading Patterns?
What is Swing Trading in Stock Market? Know Types of Swing Trading Patterns
By HDFC SKY | Updated at: Oct 8, 2025 08:01 PM IST
Swing trading is a popular trading strategy in the stock market where traders aim to capture short- to medium-term gains by holding stocks for a few days to a few weeks. It involves identifying potential price swings or trends using technical analysis, chart patterns and market indicators. Unlike day trading, swing trading doesn’t require constant monitoring and is suitable for individuals who want to trade actively but can’t commit to full-time trading.
What is Swing Trading in Stock Market?
Swing trading meaning refers to a short- to medium-term trading strategy in the stock market where traders aim to profit from price swings or fluctuations. In swing trading positions are typically held for a few days to several weeks depending on market trends, with decisions based on technical analysis and price momentum.
Swing Trading Examples;
Swing trading involves capitalising on short- to medium-term price movements. For example, buying shares of a company after a pullback and selling them when the price rallies within a few days or weeks
How Swing Trading Works
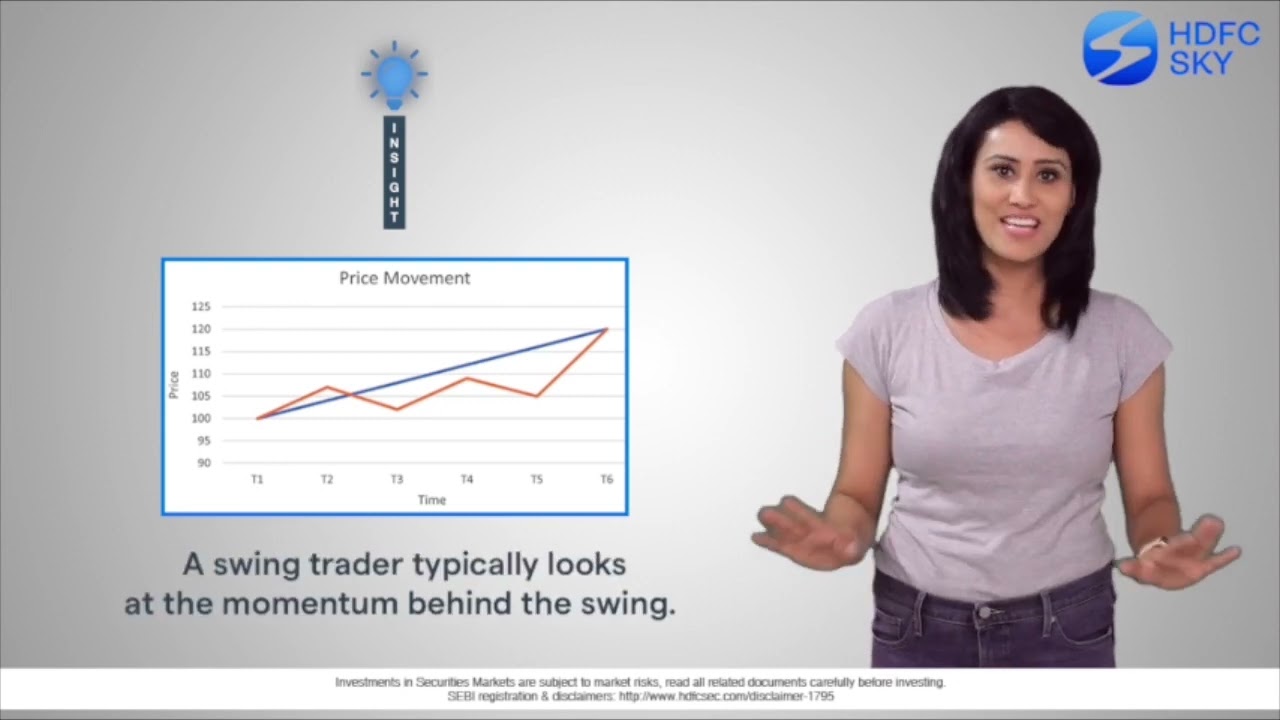
Swing trading involves identifying price trends and holding positions for a short period to benefit from expected market “swings” or fluctuations.
- Traders use technical analysis to find entry and exit points.
- Positions are typically held from a few days to a few weeks.
- Common tools include moving averages, RSI, MACD and candlestick patterns.
- Risk management strategies like stop-loss orders are crucial.
- The goal is to profit from short- to medium-term price movements.
How to Do Swing Trading
Swing trading involves capturing short- to medium-term gains by holding positions for days or weeks. It requires analysing market trends and timing entry and exit points effectively.
- Identify stocks with strong momentum and clear patterns.
- Use technical indicators like moving averages and RSI to spot potential swings.
- Enter trades when the stock shows signs of upward movement after a pullback.
- Set stop-loss orders to manage risk and protect your investment.
- Exit the trade when the price reaches resistance or momentum fades.
- Continuously monitor market conditions and adjust your strategy as needed.
Importance of Swing Trading
Swing trading offers a balanced approach between day trading and long-term investing, making it suitable for many retail investors.
- Captures short- to medium-term price movements.
- Requires less time than daily trading but is more active than investing.
- Offers multiple trading opportunities in volatile markets.
- Helps diversify strategies within a portfolio.
- Effective for traders who rely on technical analysis.
Types of Swing Trading Patterns
Swing trading chart patterns may be continuation patterns (which indicate the trend will continue) and reversal patterns (which signal a trend change). Here are some of the types of swing trading patterns:
1. Ascending Triangle
The ascending triangle pattern forms when a stock’s price shows a flat resistance line at the top and a rising support line. This creates higher lows, indicating buying pressure.
When the price goes above resistance, it signals a bullish breakout, often with higher volume. At the breakout, you should enter long and set a stop loss below rising support. The profit target is the triangle height added to the breakout point.
2. Descending Triangle
The descending triangle pattern forms when a flat support line and a downward-sloping resistance line create lower highs, indicating selling pressure. This bearish pattern signals a breakdown when the price falls below support.
This candlestick pattern for swing trading helps you spot price shifts and find the right entry time. The stop loss is above the falling resistance and the profit target is the triangle height subtracted from the breakout point.
3. Head and Shoulders
This swing trading chart pattern forms when a stock price creates three peaks: a high peak head, a lower peak on the left shoulder and another lower peak on the right shoulder. The right shoulder is typically lower than the left, forming a shape like shoulders and a head.
This chart pattern for swing trading indicates that the trend may be changing from bullish to bearish. You enter short when the price breaks below the neckline, confirmed with volume. Stop loss is above the right shoulder and the profit target is the distance from head to neckline projected downward.
4. Inverse Head and Shoulders
The inverse head and shoulders pattern flips the classic head and shoulders setup. Picture this: three dips, the middle being the deepest (head) and the two on either side shallower (shoulders).
This pattern signals a reversal from a bearish trend to a bullish one. You enter long when the price breaks above the neckline, confirming with volume.
Stop-loss is placed below the right shoulder and the profit target is the distance from head to neckline projected upward. Recognising swing candlestick patterns in this setup helps you spot key moments for entry and exit, adding extra confidence to their strategy.
5. Double Top
A double-top is a swing trading pattern that has two dips forming almost at the same level with a tiny dip in the middle. This pattern signals a bearish shift and hints that the price might start to drop soon.
6. Double Bottom
The double bottom swing trading charts form when a stock creates two troughs at nearly the same level, separated by a slight rise in between. It indicates a bullish reversal, signalling that the price will likely rise.
You should enter long when the price breaks above the intermediate high. The stop-loss is placed below the second trough and the profit target is the distance between the troughs. The intermediate high is projected upward.
7. Cup and Handle
You’ll notice a smooth, rounded bottom in the cup and handle pattern followed by a slight dip. This forms the handle. It’s a bullish signal that hints the price is about to rise.
When the price breaks through the handle’s resistance, you enter long and place your stop loss below the handle. Your profit target? It’s the height of the cup projected upwards. It’s as simple as that!
8. Flags
Flag pattern indicates a continuation of the broader trend after price for a short period moves against the trend. Flags appear after a quick price move, creating a flagpole and then a sideways pattern forms the flag. Bullish flags lean downwards following an upward trend, while bearish flags tilt upwards after a downward trend.
You enter in the direction of the breakout, placing a stop loss below the flag for bullish flags or above the flag for bearish flags. The target for profit is the length of the flagpole extended in the breakout direction.
Why Do Swing Trading Patterns Matter?
Swing trading patterns may help you spot entry and exit points. These patterns reveal market trends, reversals and breakouts allowing you to make informed decisions.
By recognising formations like triangles, heads and shoulders or flags, one may predict price movements with better accuracy. They also improve risk management by setting clear stop-loss and profit targets. Mastering these patterns helps you trade with confidence and consistency while reducing uncertainty.
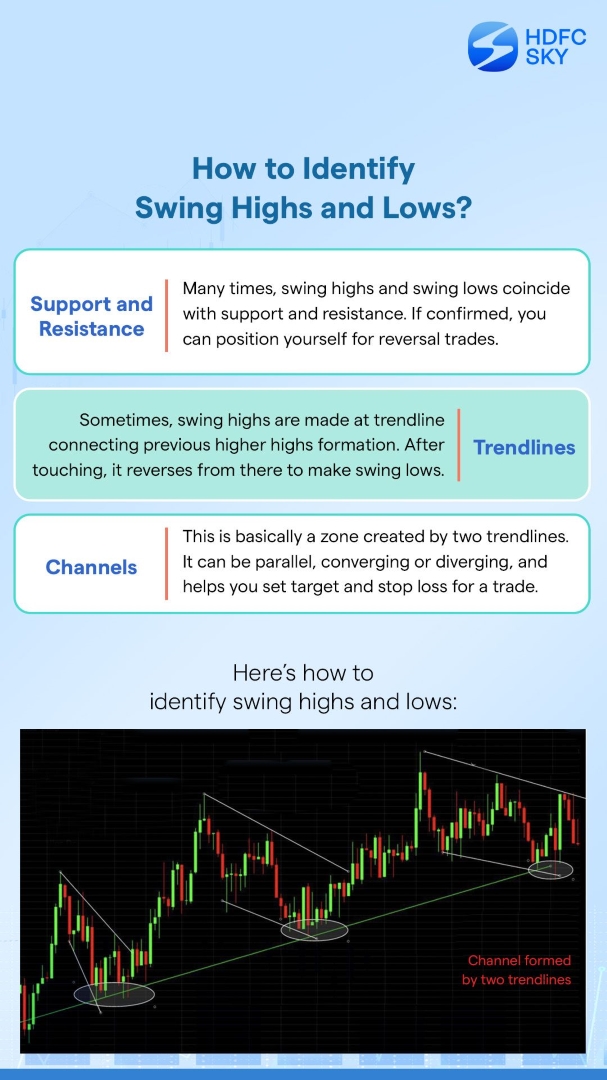
How to Identify and Apply Patterns Effectively?
You can identify swing trading patterns by analysing price charts for trend reversal breakouts and support-resistance levels. Before entering a trade, you can confirm patterns using technical indicators like moving averages, RSI and MACD.
Focus on common formations such as triangle flags and double tops to predict price movements accurately. Once identified these patterns are applied by setting entry-exit and stop-loss levels.
Backtesting and paper trading let you perfect your strategy without risking real money. Mastering chart patterns for swing trading boosts your profits and minimises risks.
Advantages of Swing Trading
Swing trading offers the opportunity to profit from short- to medium-term price movements, requiring less time commitment than day trading. It suits traders who want flexibility with their investments.
- Captures significant price swings for potential quick profits.
- Allows trading in both rising and falling markets.
- Requires less daily monitoring compared to day trading.
- Combines technical and fundamental analysis effectively.
- Helps manage risk with clear entry and exit points.
- Suitable for part-time traders balancing other commitments.
Disadvantages of Swing Trading
While swing trading can be profitable, it also comes with risks and challenges that investors should consider.
- Exposure to overnight and weekend market risks.
- Requires strong technical analysis skills.
- Potential for losses if the market moves sharply against positions.
- Trading costs can add up with frequent transactions.
- Emotional discipline is necessary to stick to strategies.
- Not suitable for investors looking for long-term growth.
Swing Trading Strategies
Swing trading involves capturing short- to medium-term gains by identifying price movements and market trends. Here are some popular strategies used by swing traders:
- Breakout Trading: Buy when the price breaks above resistance; sell when it drops below support.
- Pullback Strategy: Enter on temporary dips in an uptrend or short-term rallies in a downtrend.
- Moving Average Crossover: Buy when a short-term moving average crosses above a long-term one and sell on the opposite.
- RSI Strategy: Use Relative Strength Index to identify overbought or oversold conditions for entry and exit points.
- MACD Strategy: Trade based on MACD line crossing the signal line for momentum shifts.
- Candlestick Patterns: Utilise reversal patterns like hammer or engulfing to time trades.
- Volume Analysis: Confirm breakouts or reversals by analysing volume spikes alongside price movements.
Common Mistakes to Avoid When Trading Patterns
In pattern trading, you should be mindful of typical mistakes that could result in losses. Steering clear of these missteps will help boost your chances of success
- Entering Trades Too Early: Waiting for proper confirmation signals prevents false breakouts.
- Trading Incomplete Patterns: Ensure patterns fully form before making a trade to avoid unnecessary risks.
- Ignoring Market Context: Always analyse volume trend strength and broader market conditions.
- Over Reliance on a Single Indicator: Use multiple indicators for better accuracy instead of relying on just one.
- Neglecting Stop Loss Levels: Without a stop loss, you risk significant losses if the trade goes against you.
- Letting Emotions Control Decisions: Overtrading or holding losing positions due to fear or greed can hurt your portfolio.
- Not Backtesting Strategies: Always test trading patterns on historical data before applying them in live markets.
Technical Indicators to Complement Swing Trading Patterns
To elevate your swing trading skills, mixing technical indicators with swing trade candlestick patterns can unlock a whole new level of insight for you.
Some key indicators to use include:
- Moving Averages: Help identify the trend direction and confirm pattern signals.
- Relative Strength Index: Indicates overbought or oversold conditions assisting in entry and exit points.
- MACD: Shows momentum shifts and potential reversals.
- Bollinger Bands: Measures volatility and price levels to spot breakout opportunities.
- Volume: Confirms pattern validity; higher volume suggests stronger trends.
These indicators provide extra confirmation to minimise risk and maximise potential profits.
Difference Between Swing Trading and Long-Term Investing
Swing trading and long-term investing differ in strategy, time horizon, and risk tolerance.
| Feature | Swing Trading | Long-Term Investing |
| Time Horizon | Few days to weeks | Several years |
| Objective | Profit from short-term price movements | Wealth creation over time |
| Analysis Type | Mostly technical analysis | Mostly fundamental analysis |
| Risk Level | Higher due to short-term volatility | Lower, depending on the market |
| Trading Frequency | Frequent buy/sell actions | Infrequent trades |
| Involvement Required | Active monitoring | Passive strategy |
| Market Sensitivity | High | Moderate to low |
Conclusion
Mastering swing trading patterns involves understanding chart patterns such as Heads and Shoulders, Double Tops and Triangles and applying effective application techniques. By integrating key technical indicators such as Moving Averages, RSI and MACD, you can enhance your strategy, reduce risk and trade more consistently and successfully.
Related Articles
FAQs on What is Swing Trading Patterns?
How frequently should I trade using swing trading patterns?
There is no predetermined frequency at which you can trade using swing trading patterns. These patterns are generally used for short term trades.
Should I use other indicators with swing trading patterns?
Yes it is always good to use swing indicators along with other indicators.
How reliable are swing trading patterns?
Swing trading patterns can be reliable, but no method is foolproof. Their success depends on various factors, such as market conditions and timing. Combining patterns with other tools, such as technical indicators and risk management strategies, can help improve the reliability of trades and reduce losses.
Can swing trading patterns guarantee profits?
Swing trading patterns cannot guarantee profits, as markets are inherently unpredictable. While patterns provide a higher probability of success, factors like market sentiment, news events, and economic conditions can influence outcomes. Proper risk management and discipline are crucial in minimising losses, even when using reliable patterns.
What is the trend-following strategy for swing trading?
In swing trading, you follow a trend-following approach by spotting the current trend and trading in its direction. You look for formations like flags or triangles that align with the trend and act when these patterns suggest the trend will continue. This method uses momentum to capture bigger price movements.
How do you apply swing trading patterns for entry and exit strategies?
To effectively apply swing trading patterns, identify a clear pattern, confirm it with technical indicators, and set entry points when the pattern completes. For exits, use target prices based on pattern projections or trailing stops to lock in profits. Always manage risk with stop-loss orders to limit potential losses.