- Offerings
- Tools & Platforms
Tools & Calculators
- Open API
- Calculators
- SIP Calculator
- CAGR Calculator
- Compound Interest Calculator
- FD Calculator
- RD Calculator
- EPF Calculator
- Retirement Calculator
- HDFC SIP Calculator
- Mutual Fund Return Calculator
- Lumpsum Calculator
- Step Up SIP Calculator
- ETF SIP Calculator
- Brokerage Calculator
- Equity Margin Calculator
- SWP Calculator
- EMI Calculator
- MTF Calculator
- Pricing
- SKY Learn
- Mutual Funds
- Margin Trading
- Financial Planning
- Personal Finance
- Share Trading
- IPO
- Derivatives
- Currencies
- Intraday Trading
- Trading Strategies
- Demat Account
- Commodity
- ETF
- Piercing Candlestick Pattern Meaning?
- How Does the Piercing Line Candlestick Pattern Work?
- Formation of Piercing Line Candlestick Pattern
- How to Use a Piercing Candlestick Pattern in Trading?
- Trading Strategies for Piercing Line Candlestick Pattern
- Piercing Pattern Example
- Advantages and Disadvantages of Piercing Pattern Candlestick
- Conclusion
- FAQs on Piercing Line Candlestick Pattern
Piercing Candlestick Pattern: How to Use Piercing Candlestick Pattern in Trading?
By HDFC SKY | Updated at: Jul 24, 2025 06:22 PM IST
- Definition: The Piercing Candlestick Pattern is a two-day bullish reversal signal appearing after a downtrend, suggesting potential upward momentum.
- Formation:
- Day 1: A long red (bearish) candle indicating continued selling pressure.
- Day 2: A green (bullish) candle that opens lower but closes above the midpoint of the red candle, indicating buyer strength.
- Key Interpretation:
- Signals potential reversal of the bearish trend to bullish.
- Stronger when formed at significant support levels or accompanied by high volume.
- Ideal Trading Conditions:
- Appears after a sustained downtrend.
- The second candle’s close must penetrate at least 50% of the previous candle’s body.
- Confirmation can be awaited through subsequent bullish candles or technical indicators.
- Limitations:
- It should not be traded in isolation.
- False signals are possible in sideways or weakly trending markets.
- Use in Strategy:
- Combine with moving averages, RSI, or volume analysis for higher accuracy.
A piercing candlestick pattern is a two day candlestick pattern. It indicates a short term reversal from a downtrend. This reversal is a short term one, lasting for just 5 days. This is an easy to use and understand, candlestick pattern.
Piercing Candlestick Pattern Meaning?
The piercing pattern is a two-candlestick reversal formation that appears after a downtrend. It signals a potential shift in momentum and is a key pattern in technical analysis that helps traders identify possible buy opportunities.
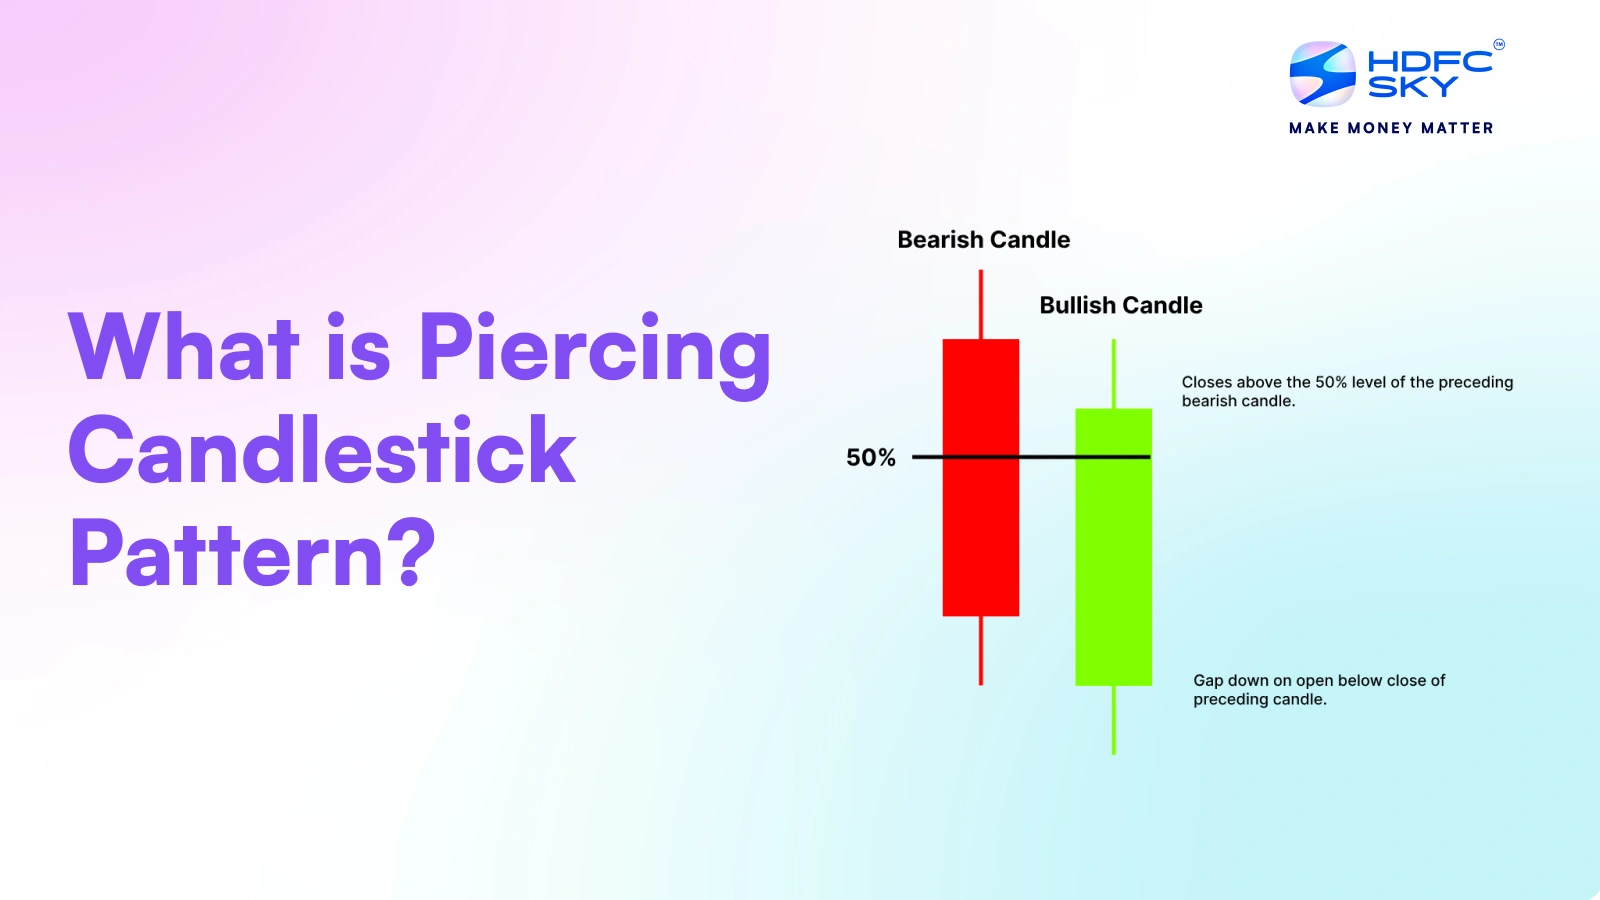
The pattern consists of two candles:
- The first is a long red (bearish Piercing Candlestick Pattern) candlestick, indicating strong selling pressure.
- The second is a green (bullish Piercing Candlestick Pattern) that opens near the previous day’s low but closes above the midpoint of the previous bearish candle.
The second candle should cover at least half of the upper end of the body of the previous day’s candle.
This formation suggests buyers are stepping in, potentially reversing the downward trend. Now that you know the meaning of piercing patterns, let us move on to understanding how to trade the piercing pattern in practical situations.
How Does the Piercing Line Candlestick Pattern Work?
The piercing candle pattern suggests that market sentiment might be shifting during a downtrend. Initially, sellers push prices lower, but buyers step in with strength, driving the price back up and closing it above the midpoint of the previous bearish candle. This suggests a possible trend reversal.
To confirm the piercing pattern, traders often look for additional bullish signals, like an uptick in trading volume or a strong support level.
Formation of Piercing Line Candlestick Pattern
The piercing line candle pattern forms under specific market conditions and provides an essential signal for traders. It appears as a long red candle stretching downward, showing aggressive selling.
The next trading session opens near the low of the previous day, but instead of continuing downward, buyers step in, lifting the price upwards. This forms a green candle that closes near the high of the day.
This shift signals a possible reversal, making it a crucial pattern for traders looking for bullish opportunities. Here’s how it forms:
- Downtrend Presence: The pattern occurs after a prolonged downtrend, indicating that selling pressure has dominated the market.
- First Candle (Bearish): A long red candle represents strong selling activity, reinforcing bearish sentiment. This candle opens near the high and closes near the low.
- Gap Down Opening: The second candle opens near the low of the previous day.
- Bullish Close: The second candle pushes up and closes near the high.
- Volume Confirmation: Higher trading volume during the second candle enhances the reliability of the piercing candlestick chart pattern, as it indicates strong buyer interest.
It visually appears as a strong red bearish candle, followed by a green bullish Piercing Line Candlestick Pattern that starts with a gap down but pushes upward with significant momentum.
How to Use a Piercing Candlestick Pattern in Trading?
Traders use the piercing chart pattern to anticipate potential price reversals in the very short term. It is most effective when combined with other technical indicators. Let’s understand how to use a piercing line candlestick pattern:
- Identify a Downtrend: The pattern should form after a bearish trend.
- Look for Pattern Formation: Observe the two-candle setup, ensuring the second candle closes above the first candle’s midpoint.
- Check Volume and Indicators: High volume and indicators like the RSI (Relative Strength Index) or MACD (Moving Average Convergence Divergence) strengthen the signal.
- Enter a Trade: Traders typically enter a long position after confirmation from the next candle.
- Set Stop-Loss and Target: Place a stop-loss and profit target based on resistance levels.
Trading Strategies for Piercing Line Candlestick Pattern
Before diving into trading strategies, it’s crucial to understand how the piercing line candlestick pattern works in different market conditions. Below, we explore some proven strategies traders use to capitalise on this bullish reversal signal.
1. Breakout Confirmation Strategy
- Wait for the piercing line trading pattern to form.
- Confirm with a bullish breakout above a resistance level.
- Enter the trade with a stop-loss below the pattern’s low.
2. Support Level Strategy
- Use support levels to identify high-probability trades.
- If the piercing candlestick forms near a support zone, it strengthens the reversal signal.
3. Moving Averages Crossover
- Combine with moving averages like the 50-day and 200-day EMA.
- If the bullish piercing occurs near a crossover, it signals a stronger reversal.
This pattern can be effectively combined with various technical indicators and trading methods to increase its reliability.
Piercing Pattern Example
Consider a stock trading in a downtrend at ₹500. The first bearish candle closes at ₹480, followed by a second candle opening at ₹470 but closing at ₹490, the high of that day.. This piercing candlestick pattern suggests a shift in momentum, prompting traders to enter a long position.
Advantages and Disadvantages of Piercing Pattern Candlestick
Understanding the advantages and disadvantages of the piercing candlestick pattern can help traders make informed decisions. While it provides a reliable signal for bullish reversals, it is not foolproof.
Here are the key benefits and potential drawbacks of using this piercing candlestick chart pattern in trading:
Advantages of Piercing Pattern Candlestick
- Indicates potential trend reversal in the short term.
- Easy to identify.
- Works well with other indicators.
- Provides an early entry point into a bullish move.
Disadvantages of Piercing Pattern Candlestick
- It is less reliable without volume confirmation.
- It can produce false signals in weak markets.
- Additional confirmation may be required from technical indicators.
Conclusion
Understanding the meaning of the piercing pattern candlestick is essential for traders aiming to identify short term reversals during a downtrend. When a piercing pattern candlestick chart is used with volume analysis, support levels, and momentum indicators, it enhances trading accuracy. While powerful, traders should confirm signals before entering a trade.
Related Articles
FAQs on Piercing Line Candlestick Pattern
Is the piercing pattern bullish or bearish?
The bullish piercing pattern is a short reversal indicator, during a downtrend that signals a potential trend shift from bearish to bullish.
What is a piercing line pattern?
A piercing line pattern is a two-candlestick formation that appears after a downtrend. In this pattern, the second candle closes near the high of the day.
What is the difference between piercing and bullish engulfing?
The bullish piercing candlestick pattern partially covers the previous bearish candle while the bullish engulfing fully engulfs it.
What is the difference between a piercing pattern and a dark cloud cover?
The piercing pattern is bullish, while the dark cloud cover is its bearish counterpart. Both patterns form after an uptrend.
What is the opposite of the piercing pattern?
The dark cloud cover is the opposite, signalling a bearish reversal after an uptrend.
What is the target price for a piercing pattern?
Nearby resistance levels and previous highs may be used for deciding on the target price.
How is the confirmation of a piercing pattern achieved?
Confirmation comes from a bullish close on the next trading day, ideally with increased volume.
Can a piercing pattern indicate a trend reversal?
Yes, the piercing candle pattern suggests a short term trend reversal from a downtrend, but traders should confirm with additional technical indicators.