- Offerings
- Tools & Platforms
Tools & Calculators
- Open API
- Calculators
- SIP Calculator
- CAGR Calculator
- Compound Interest Calculator
- FD Calculator
- RD Calculator
- EPF Calculator
- Retirement Calculator
- HDFC SIP Calculator
- Mutual Fund Return Calculator
- Lumpsum Calculator
- Step Up SIP Calculator
- ETF SIP Calculator
- Brokerage Calculator
- Equity Margin Calculator
- SWP Calculator
- EMI Calculator
- MTF Calculator
- Pricing
- SKY Learn
- Mutual Funds
- Margin Trading
- Financial Planning
- Personal Finance
- Share Trading
- IPO
- Derivatives
- Currencies
- Intraday Trading
- Trading Strategies
- Demat Account
- Commodity
- ETF
- What is Exponential Moving Average (EMA)?
- Objective of Moving Averages
- How Does Exponential Moving Average (EMA) Work?
- Exponential Moving Average Formula
- How to Calculate Exponential Moving Average in the Stock Market
- What Does the EMA Reveal About the Market?
- Examples of How to Use the EMA Trading Strategy
- Difference Between Simple Moving Average and Exponential Moving Average
- Advantages of Exponential Moving Average (EMA)
- Limitations of Exponential Moving Average (EMA)
- What is Considered a Good Exponential Moving Average?
- Exponential Moving Average (EMA) Trading Strategies
- Conclusion
- FAQs on What is Exponential Moving Average?
What is Exponential Moving Average (EMA) & How Does Exponential Moving Average (EMA) Work?
By HDFC SKY | Updated at: Oct 30, 2025 08:51 PM IST
Summary
- Exponential Moving Average (EMA) is a widely-used technical indicator that gives more weight to recent prices, making it more responsive than the Simple Moving Average (SMA).
- Common EMAs include 10-day, 50-day, and 200-day averages; shorter EMAs are used for quick trades, while longer ones help identify major trends.
- Popular EMA Strategies:
- EMA Crossover: Buy signal when a short-term EMA crosses above a long-term EMA; sell signal when it crosses below.
- Support & Resistance: EMA levels often act as dynamic support or resistance zones.
- Trend Confirmation: Traders use the EMA slope direction to validate trend strength and entry points.
- The benefits of EMA include quicker trend detection and suitability for fast-moving markets, especially in intraday and swing trading.
- Limitations include higher sensitivity to price noise, leading to false signals in volatile markets.
- Best used in combination with other indicators like RSI or MACD for higher accuracy in trading decisions.
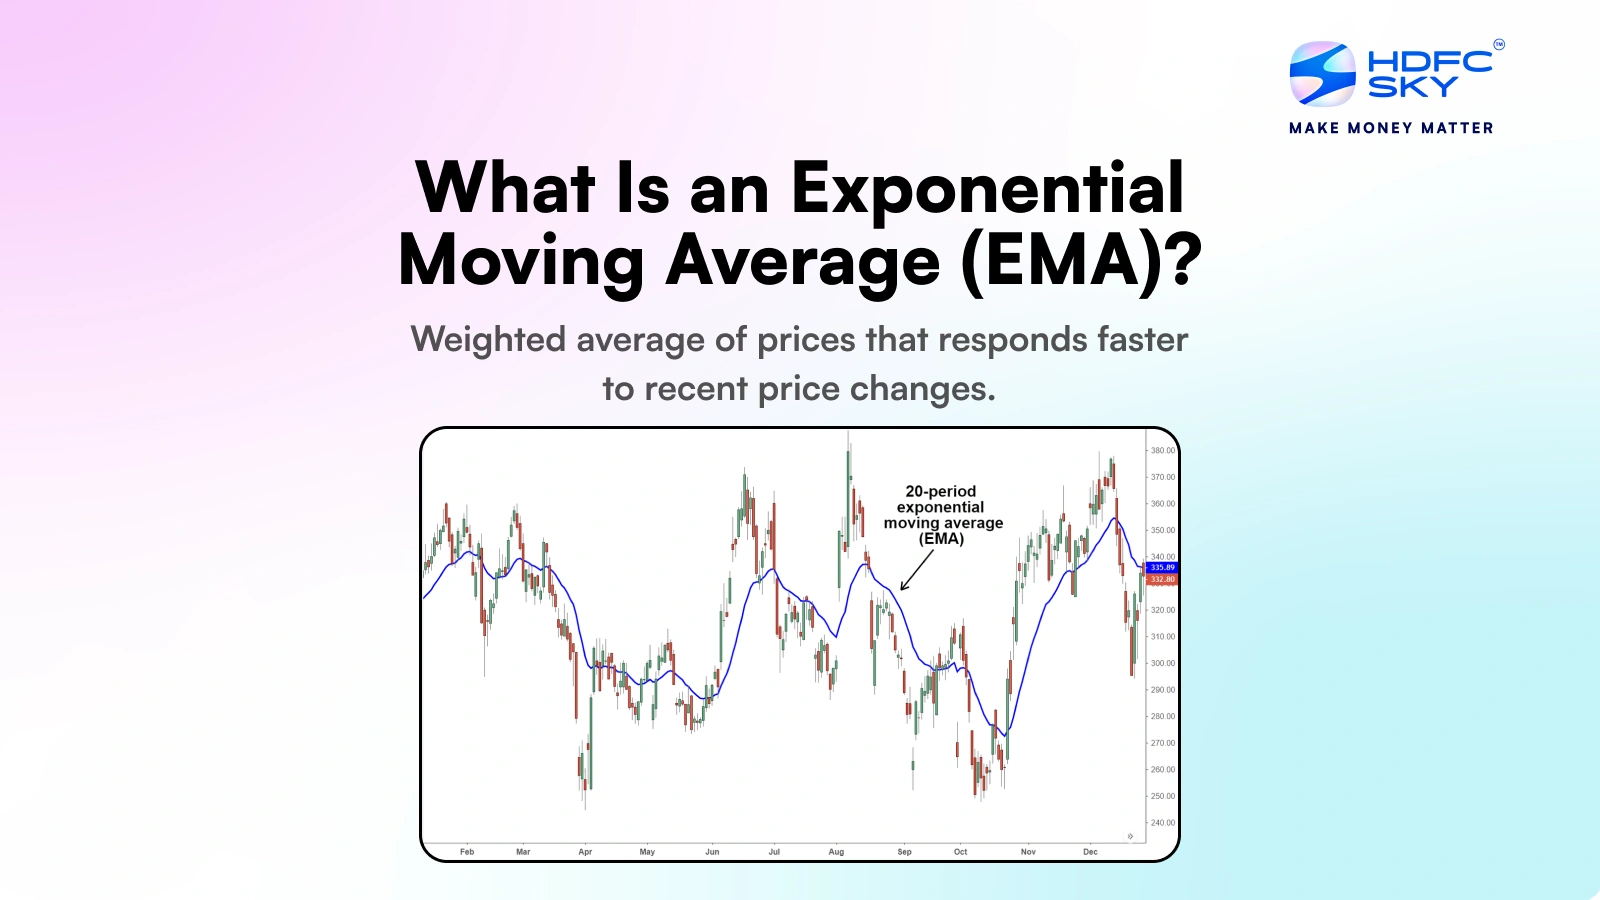
The Exponential Moving Average (EMA) is a widely used technical indicator in stock trading that gives more weight to recent price data to make trend analysis more responsive. The EMA full form is Exponential Moving Average and it helps traders identify the direction of a stock’s movement more quickly than simple moving averages. By smoothing out price fluctuations EMA allows investors to make more informed short- to medium-term trading decisions.
What is Exponential Moving Average (EMA)?
Exponential Moving Average (EMA) is a type of moving average that places greater weight on recent price data, making it more responsive to new market trends. The exponential moving average meaning lies in its ability to smooth out price fluctuations while quickly reacting to price changes, helping traders identify potential entry or exit points in a security. It is widely used in technical analysis to gauge momentum and trend direction.
Objective of Moving Averages
Moving averages help traders and investors smooth out price data to identify the direction of a trend over a period. They filter out short-term volatility and provide clearer signals for buying or selling.
- Identify and confirm trends
- Reduce market noise
- Generate entry and exit signals
- Support technical analysis
- Help with forecasting future price movements
How Does Exponential Moving Average (EMA) Work?
The Exponential Moving Average (EMA) gives more weight to recent prices, making it more responsive to new information compared to a simple moving average.
- EMA calculates the average price over a specific period, applying a smoothing factor to emphasise recent data.
- This helps traders identify current market trends more quickly.
- When prices cross above or below the EMA it can signal potential buy or sell opportunities.
- EMA is often used with other indicators to confirm trend strength and momentum.
Exponential Moving Average Formula
The exponential moving average formula gives more importance to recent price data, making it a preferred tool for traders who need quick responses to market changes. Unlike the Simple Moving Average (SMA), which assigns equal weight to all data points, the EMA applies a smoothing factor that prioritises the most recent prices. This makes the EMA particularly effective in identifying short-term trends and reacting to price fluctuations more efficiently.
The exponential moving average formula: EMA = (Current Price × Smoothing Factor) + (Previous EMA × (1 – Smoothing Factor))
Let’s break down the formula of EMA with a practical example. Suppose you’re tracking a stock that’s currently trading at ₹500. Using a 20-day EMA, the smoothing factor would be 2/(20+1) = 0.0952. This means today’s price contributes about 9.52% to the new EMA value, while previous data maintains about 90.48% influence. This weighted approach helps traders identify trend changes more quickly than traditional averages.
Modern trading platforms automate these calculations, saving traders time and reducing errors.
How to Calculate Exponential Moving Average in the Stock Market
Calculating the Exponential Moving Average (EMA) is a step-by-step process that starts with a basic foundation and then builds upon it.
Step 1: Start with the Simple Moving Average (SMA)
To begin, calculate the Simple Moving Average (SMA). For example, if a stock has been trading for 20 days with prices ranging from ₹95 to ₹105, the first step is to add up all the daily closing prices and divide the total by 20. This gives you the SMA, which serves as the starting point for the EMA calculation.
Step 2: Adjust for New Prices
After calculating the SMA, the EMA starts to take shape. With each new day, the EMA assigns more weight to the latest price, while gradually reducing the influence of previous prices.
For example, if our stock suddenly jumps to ₹110, the EMA will react more quickly to this change than a simple average, making it particularly useful for traders who need to spot trends early.
What Does the EMA Reveal About the Market?
The Exponential Moving Average (EMA) helps traders identify market trends by reacting quickly to recent price changes. It highlights momentum and potential reversals.
- Trend Direction: A rising EMA signals a bullish trend, while a falling EMA indicates a bearish trend.
- Momentum Strength: Steeper EMAs show stronger price momentum in the direction of the trend.
- Dynamic Support and Resistance: Prices often bounce off EMAs, making them useful as support in uptrends and resistance in downtrends.
- Entry and Exit Signals: EMA crossovers (e.g., 12-day crossing above 26-day) are common indicators for buying or selling.
- Price Smoothing: EMA filters out short-term noise, providing a clearer view of price movements.
Examples of How to Use the EMA Trading Strategy
An EMA trading strategy can be applied in various ways to suit different market conditions. Let’s explore some practical applications with real-world examples.
A common approach involves using multiple EMAs together, like combining a 20-day and 50-day EMA. For instance, when the 20-day EMA crosses above the 50-day EMA, it creates what traders call a “golden cross,” signalling potential bullish momentum. Imagine a stock trading at ₹1,500 when its 20-day EMA crosses above the 50-day EMA, it might suggest the beginning of an uptrend.
Another powerful strategy involves using EMAs as dynamic support and resistance levels. Consider a stock consistently bouncing off its 200-day EMA during an uptrend this EMA acts like a safety net, catching the price each time it falls. Traders often use these bounces as buying opportunities, placing their stops just below the EMA level.
Difference Between Simple Moving Average and Exponential Moving Average
| Factor | Simple Moving Average (SMA) | Exponential Moving Average (EMA) |
| Weightage to Data | Gives equal weight to all data points | Gives more weight to recent data |
| Responsiveness | Slower to react to price changes | Faster reaction to price changes |
| Calculation Complexity | Simple and straightforward | More complex due to weighting formula |
| Usage | Used for long-term trend analysis | Preferred for short-term trading strategies |
| Lag | Higher lag in volatile markets | Lower lag, more responsive to trends |
Advantages of Exponential Moving Average (EMA)
The EMA offers a responsive and insightful tool for traders by giving more weight to recent prices, making it ideal for fast-paced market environments.
- React Faster to Price Changes: EMA adjusts more quickly to recent price movements than a simple moving average (SMA).
- Ideal for Short-Term Trading: Popular among day and swing traders due to its sensitivity to price fluctuations.
- Improved Trend Identification: Helps spot the start of new trends earlier compared to SMA.
- Useful in Crossover Strategies: EMA crossovers are widely used for generating buy or sell signals.
- Reduces Market Noise: Smooths out price action while still reflecting recent activity, aiding clearer analysis.
- Customisable Time Frames: Traders can adjust EMA lengths based on their trading style (e.g., 9, 20, 50-day).
Limitations of Exponential Moving Average (EMA)
While EMA is effective in highlighting recent price trends, it has its drawbacks that traders should be aware of. Understanding these limitations helps in making better trading decisions.
- Lagging Indicator: EMA is based on past price data, so it may react late to sudden market changes.
- False Signals in Sideways Markets: During range-bound or choppy markets, EMAs can generate misleading signals.
- Over-Sensitivity: While it gives more weight to recent prices, this can lead to overreacting to short-term volatility.
- Needs Confirmation: EMA should be used with other indicators for reliable trading decisions, as it doesn’t consider volume or fundamentals.
What is Considered a Good Exponential Moving Average?
A good Exponential Moving Average (EMA) depends on the trading strategy and time horizon of the trader. Commonly used EMA periods include:
- Short-term trading (fast EMA): 9-day or 12-day EMA for quick trend detection and responsiveness to price changes.
- Medium-term trading: 26-day or 50-day EMA to capture intermediate trends with balanced responsiveness and stability.
- Long-term trading (slow EMA): 100-day or 200-day EMA for long-term trend identification and reduced market noise.
Traders often use combinations of EMAs, such as the 12-day and 26-day EMAs for short-term analysis or the 50-day and 200-day EMAs for long-term trends. The choice of EMA depends on the asset’s volatility, market conditions and individual trading goals.
For example, a scalper (who focuses on making multiple quick trades within a short period to profit from small price movements) might use a 5 and 13 EMA combination to capture quick price movements, while a position trader (holds trades for a longer duration, aiming to capitalise on major market trends) might rely on the 50 and 200 EMA crossovers for major trend changes. The key is matching the EMA period to your trading style and time horizon.
Exponential Moving Average (EMA) Trading Strategies
EMA is widely used by traders to identify trends, entry and exit points in the market.
- EMA Crossover: Buy when a short-term EMA crosses above a long-term EMA; sell when it crosses below.
- Support and Resistance: EMA lines act as dynamic support or resistance levels during trending markets.
- Trend Confirmation: Use EMA slope direction to confirm the strength of a trend before making trades.
- Combining with Other Indicators: Pair EMA with RSI or MACD to reduce false signals and improve accuracy.
Conclusion
The Exponential Moving Average is a powerful tool in the modern trader’s arsenal. While it’s not a crystal ball that can predict future prices, it can provide valuable insights into market trends and potential trading opportunities when used properly alongside other technical analysis tools. Remember, successful trading isn’t about finding a perfect indicator but understanding and effectively using the tools at your disposal.
Related Articles
FAQs on What is Exponential Moving Average?
How is EMA different from SMA?
EMA reacts faster to price changes, while SMA gives equal importance to all data points.
Can EMA predict future stock prices?
No, EMA identifies trends and momentum but cannot predict future prices directly.
Is the Exponential Moving Average Better Than the Simple Moving Average?
The Exponential Moving Average (EMA) is better for short-term trading as it reacts faster to recent price changes. This makes it ideal for capturing quick market movements. On the other hand, the Simple Moving Average (SMA) is better suited for long-term trend analysis due to its smoother and less volatile nature.
What Are the EMAs for Intraday Trading?
For intraday trading, traders commonly use shorter-period EMAs like the 8-day, 12-day, and 20-day EMAs. These shorter EMAs provide quick signals, helping traders make decisions in fast-moving markets. The shorter the period, the more sensitive the EMA becomes to SMAll price changes, making it suitable for quick trades.
How Can Traders Understand the EMA in Stocks Indicator on a Trading Chart?
The EMA indicator on a trading chart appears as a smooth line tracking price movements. Traders use crossovers to identify trends: when the price crosses above the EMA, it signals a buy, and when it falls below, it signals a sell. Watching the EMA’s slope also reveals market direction.
When to Use Exponential Moving Average?
The EMA is most useful when traders need to analyse recent price trends quickly. It’s particularly effective in volatile or fast-moving markets, such as during intraday trading. Traders use it to follow the current trend, set entry/exit points, or confirm trading signals from other technical indicators
What is a basic exponential moving average strategy?
Common EMA strategies include trading when the price crosses above/below EMA, using multiple EMAs to confirm trends, and watching for EMA crossovers as entry/exit signals.
What are key indicators of exponential moving averages?
Key EMA indicators include crossovers between different EMAs (like 9 and 21-day), price-crossing EMA lines, and convergence/divergence patterns.